

|
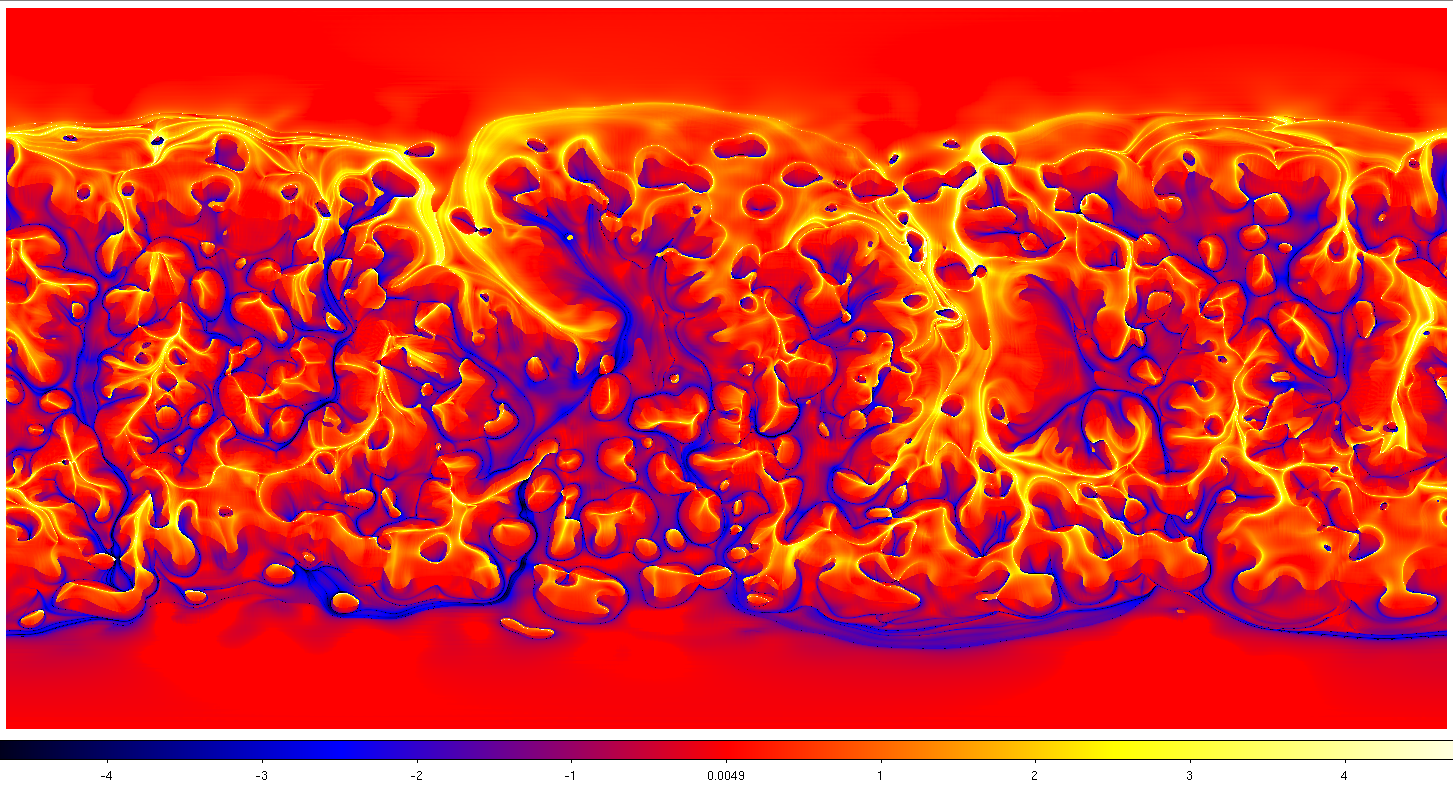
The top figure shows the Q-map for August 25, 2018. The map is 360 degrees wide and extends from pole to pole The left 120 degrees of the input map has been constructed from a magnetogram taken at 12 UT on that day. | |

|
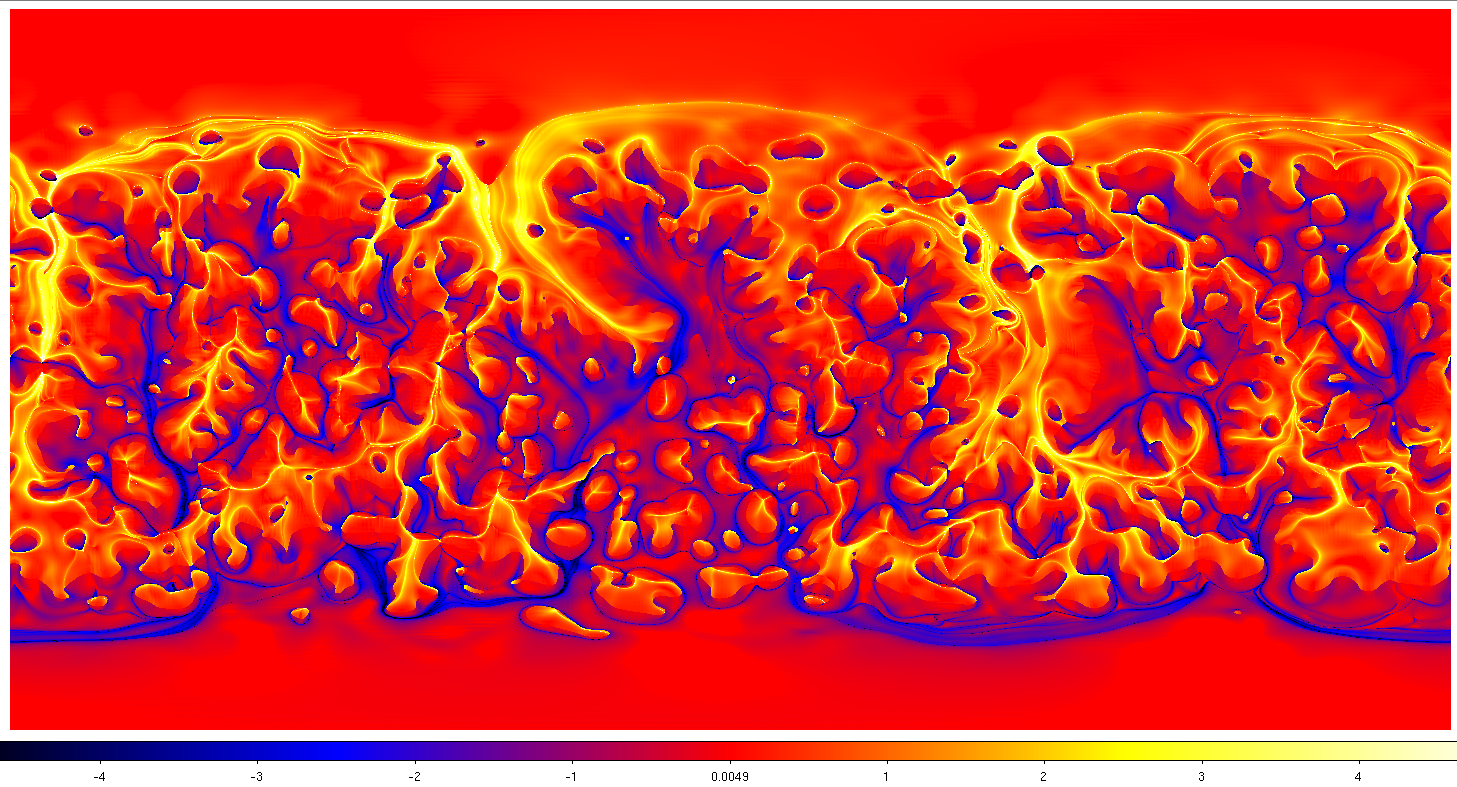
The bottom figure shows the daily Q-map plotted to the same scale for the next day, August 26, 2018. The first longitude of the map has moved one day (about 13 degrees) to the left, so features appear to the right of the map above. |
Differences arise because photospheric conditions change from one day to the next, but also
features rotate into and out-of the window --
the window in longitudes changes (new data are added on the left), and
the boundary of old/current data shifts (the daily 120 degree window ends at a different longitude).
Differences are not confined to the left side of the map, because the PFSS model is a global model.
Note that features on the left and right edges of the maps are spatially adjacent in the PFSS model,
but separated by 20 or more days in the time of observation.