
SDO HMI-AIA Joint Science Operations Center (JSOC)
Continuum intensity synoptic charts are maps of the Sun produced by continuum intensity images with limb darkening removed (The series name of continuum intensity image is hmi.Ic_noLimbDark_720s).
Carrington synoptic charts of continuum intensity are produced from the HMI 720-second full-disk continuum intensitygrams (hmi.Ic_noLimbDark_720s). The limb darkening in the intensitygrams are removed. The intensitygrams are firstly remapped to a Carrington coordinate grid of 1800 by 1440. Then the intensity measured at each synoptic grid point is averaged from all of the contributing remapped intensitygrams, after taking into account the differential rotation, to form a map of the entire solar surface. Currently the average is done with the measurements from the twenty 720-s intensitygrams that contribute pixels observed closest to the central meridian. The effective temporal width of the HMI synoptic-map contribution is about four hours at each Carrington longitude, i.e. within two hours of central meridian passage. This means that the pixels used are roughly within ± 1.2 degrees of central meridian. The axes are linear in Carrington longitude and sine latitude. The size of the maps is 3600 by 1440.
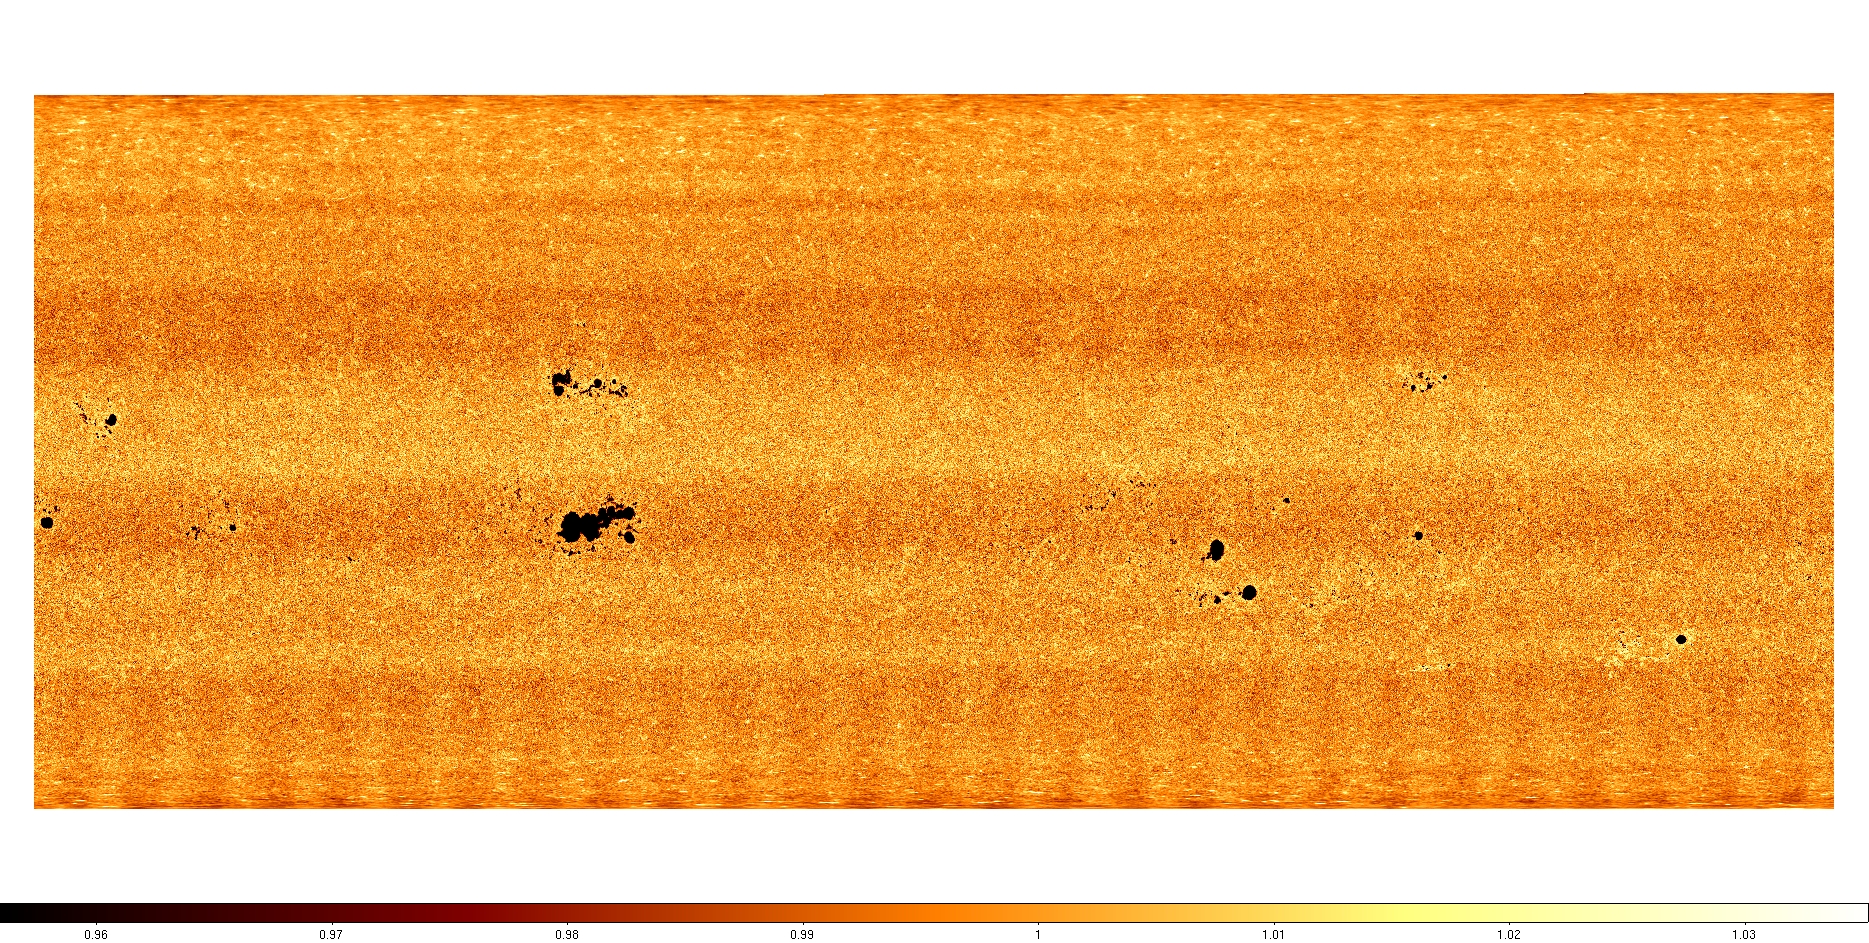 Fig. 1: Intensity synoptic chart for CR2146
Patterns are seen in the intensity synoptic charts. Fig. 1
shows an example of intensity synoptic chart for Carrington Rotation 2146. Horizontal bands are
seen at several latitudes. There are vertical patterns toward the southern pole.
The pattern changes both during the day and during the year. It is some combination of residual front window fringes
and tuning issues connected with the fact the Ic uses all tuning positions, and the flat field process: It does well
at very short range but poorly at large distances. The same flat field is used for the entire day. So for instance
any variation during the day cannot be corrected (Phil Scherrer 2014).
Fig. 1: Intensity synoptic chart for CR2146
Patterns are seen in the intensity synoptic charts. Fig. 1
shows an example of intensity synoptic chart for Carrington Rotation 2146. Horizontal bands are
seen at several latitudes. There are vertical patterns toward the southern pole.
The pattern changes both during the day and during the year. It is some combination of residual front window fringes
and tuning issues connected with the fact the Ic uses all tuning positions, and the flat field process: It does well
at very short range but poorly at large distances. The same flat field is used for the entire day. So for instance
any variation during the day cannot be corrected (Phil Scherrer 2014).
 Fig. 2: Variation of intensity
More quantitatively, variation of intensity over an intensity synoptic chart is about 1% on average.
Fig. 2 shows variation of intensity as a function of
latitude and longitude for the intensity synoptic chart CR 2146. Left panel represents the rms of pixels
in centain columns of the data array of the synoptic chart. The sudden jumps at a few longitudes are attribute
to sunspots in the columns. Right panel refers to rms of pixels in certain rows of the data array. High rms
near the equator corresponds to the horizontal bright band. Much higher rms in the southern polar region
than its counterpart in the northern is probably due to the vertical strips seen in the southern polar region.
Fig. 2: Variation of intensity
More quantitatively, variation of intensity over an intensity synoptic chart is about 1% on average.
Fig. 2 shows variation of intensity as a function of
latitude and longitude for the intensity synoptic chart CR 2146. Left panel represents the rms of pixels
in centain columns of the data array of the synoptic chart. The sudden jumps at a few longitudes are attribute
to sunspots in the columns. Right panel refers to rms of pixels in certain rows of the data array. High rms
near the equator corresponds to the horizontal bright band. Much higher rms in the southern polar region
than its counterpart in the northern is probably due to the vertical strips seen in the southern polar region.