| input data and initial PFSS magnetic field | daily NRT simulation | other solar obs. |

|
|

|
| input data and initial PFSS magnetic field | daily NRT simulation | other solar obs. |
|
|
|
|
synoptic frame map
latest map in FITS format (∼ 20MB) and WSO data format (∼ 21kB). year-to-date(*) mp4 |
PFSS model plot
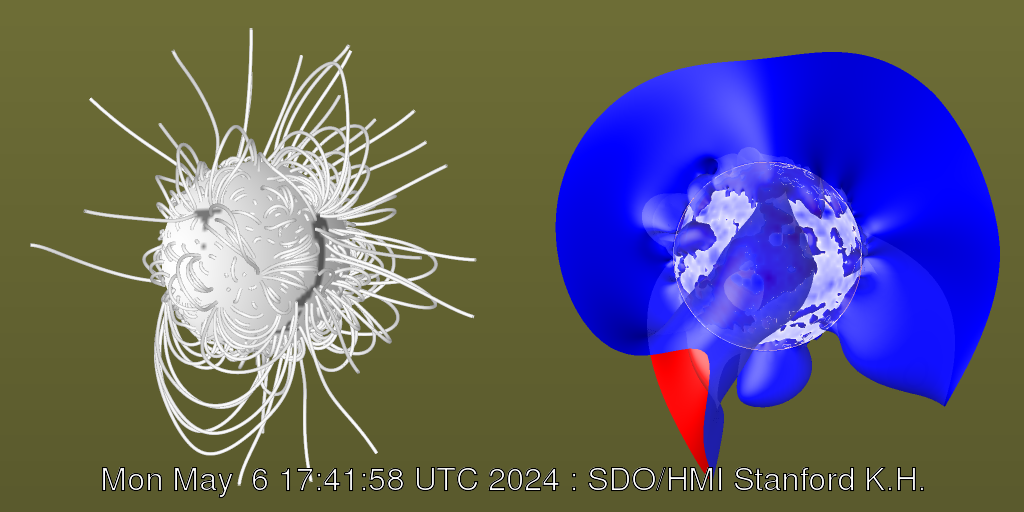
left : field lines and bases of open field right: zero-Br contour surfaces. 3-D FITS data: radial, lat., and long.. year-to-date(*) mp4 |
PFSS (without Br-offset)
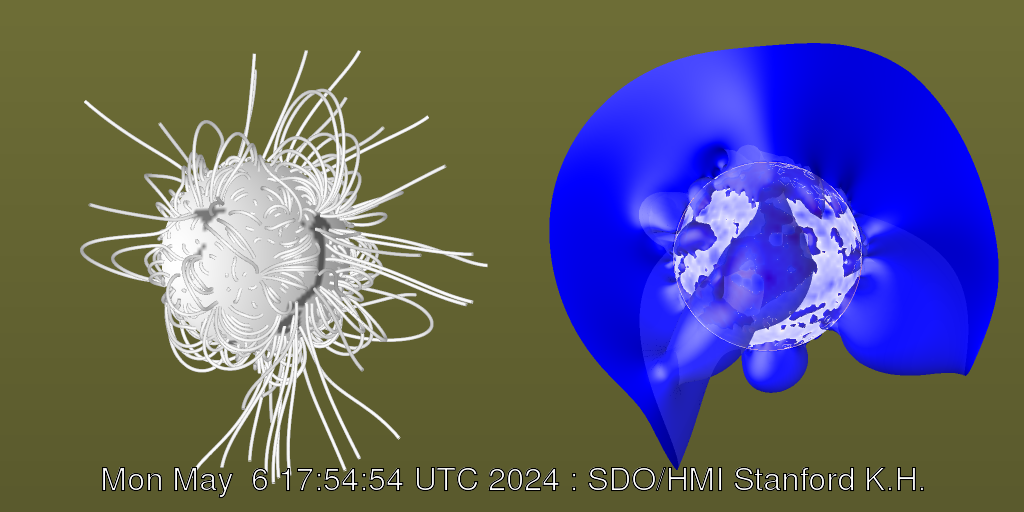
left : field lines and bases of open field right: zero-Br contour surfaces. 3-D FITS data: radial, lat., and long.. year-to-date(*) mp4 |
plots made:
Wed Jul 22 18:55:08 UTC 2026 (Wed Jul 22 11:55:08 PDT 2026)
|
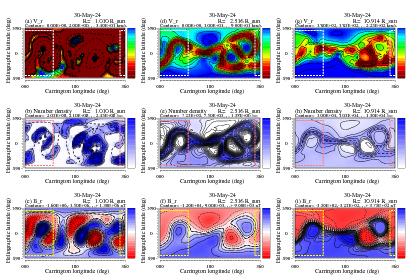
lat-lon map at various distances
click here to enlarge. |
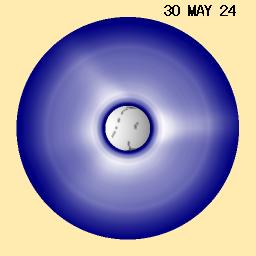
coronal brightness (white corona)
and coronal holes |
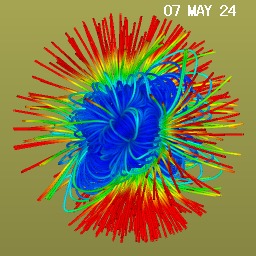
field line and speed (blue-yellow-red : stagnant-slow-fast) |
|
|
|
|
|
recent 27 plots (mpeg movie)
year-to-date(*) mp4 |
recent 27 plots (mpeg) year-to-date(*) mp4 |
|
| Latest data files *Please contact us for details of the simulation and data. | |||||||||||||||||||||||||||||||||||||||||||||||||||||||||||||||||||||||||||||||||||||||||||||||||||||||||||||
| maps at 30 Rs: Vr (in km/s) and Br (in nT) in CSV (Comma Separated Values; plain text) format | |||||||||||||||||||||||||||||||||||||||||||||||||||||||||||||||||||||||||||||||||||||||||||||||||||||||||||||
|
a cubic data containing all eight MHD variables :
click here (FITS format, approx. 6.5MB).
This single FITS file contains all eight simulated MHD variables, from 1.01 to 4.96 Rs. The size of this cubic data is 32 x 64 x 640. The first 80-layer block, (*,*,0:79), is for the density (in count/cc) at heights of (1.01 + i * 0.05) Rs, i.e., from 1.01 Rs to 4.96 Rs with a fixed equi-radius interval of 0.05Rs. The second to eighth 80-layer blocks are respectively for the temperature (in MK), V_r, V_theta, V_phi (in km/s), B_r, B_theta and B_phi (in Gauss). Please mind that the format and specifications of this FITS file are different from those at JSOC database. |
|||||||||||||||||||||||||||||||||||||||||||||||||||||||||||||||||||||||||||||||||||||||||||||||||||||||||||||
| Some movies: | |||||||||||||||||||||||||||||||||||||||||||||||||||||||||||||||||||||||||||||||||||||||||||||||||||||||||||||
|
|||||||||||||||||||||||||||||||||||||||||||||||||||||||||||||||||||||||||||||||||||||||||||||||||||||||||||||
|
(*) Many movie frames are missing because of disk failutre.
(d) SDO/HMI daily synoptic maps have been regularly generated at JSOC, and used in this daily-MHD model, from July 1. 2011. (c) Transition of input data, from MDI to HMI. (b) SOHO/MDI daily-updated synoptic maps were used until the end of 2010. (a) Polar-field correction was applied to the input MDI synoptic map data, except for a few earliest weeks. |
|||||||||||||||||||||||||||||||||||||||||||||||||||||||||||||||||||||||||||||||||||||||||||||||||||||||||||||
| definitive daily data : | magnetic field map and three-dimensional MHD data |
| definitive once-a-Carrington-Rotation data : | magnetic field map and three-dimensional MHD data |
external images/data fetched:
Wed Jul 22 11:30:16 UTC 2026 (Wed Jul 22 04:30:16 PDT 2026)
| HMI synchronic frame map |
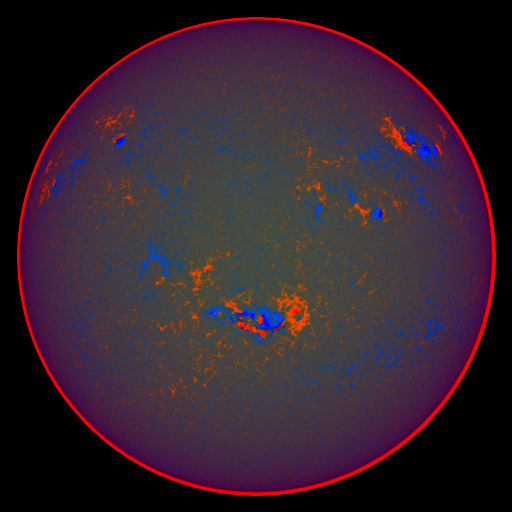
HMI full-disk |
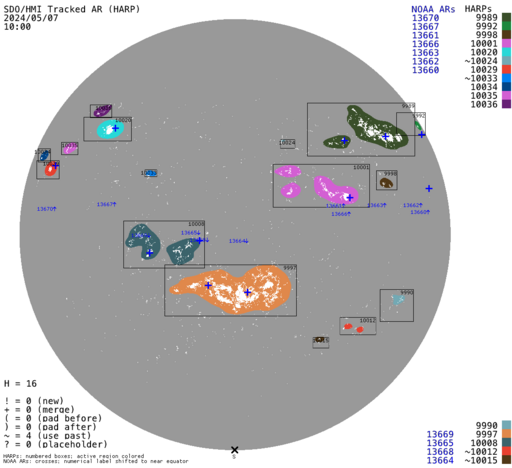
HARP |
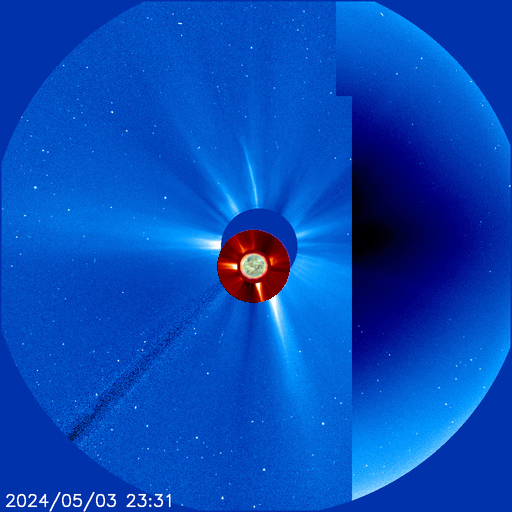
LASCO and AIA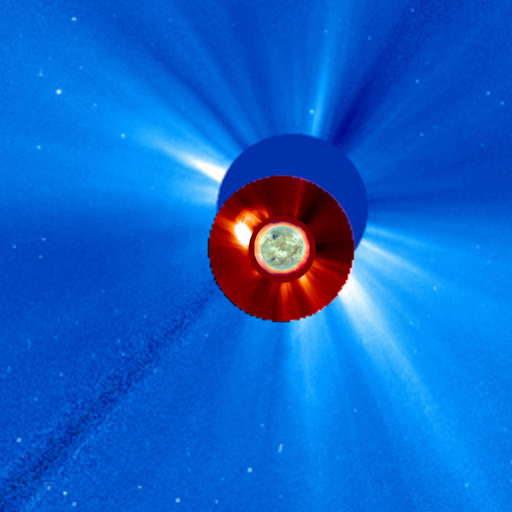 |
C2 and AIA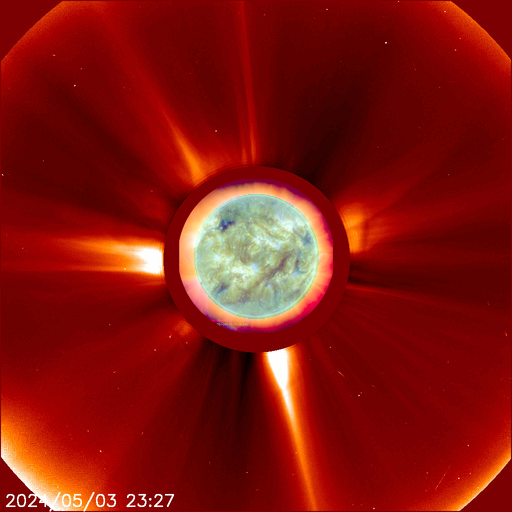 |
MHD corona |
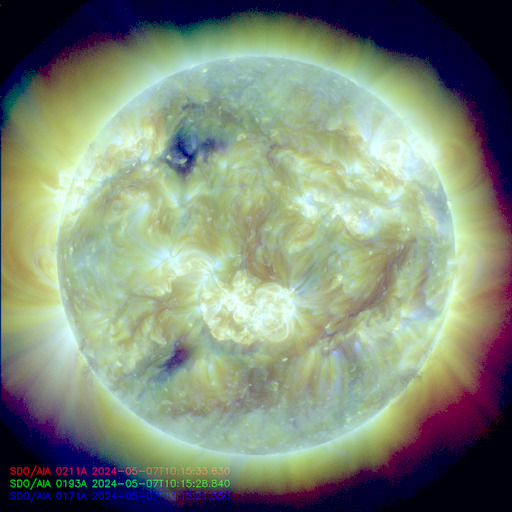
AIA |
CH(PFSS) |
PFSS line and zero-Br surf. |
ACE real-time mag.epam |
ACE real-time mag. |
ACE real-time epam |
STEREO Synop. |
STEREO A COR2 |
STEREO A COR1 |
STEREO A 195 |
STEREO B 195 |
STEREO B COR1 |
STEREO B COR2 |