
William Ma1,2 and Philip H. Scherrer1
1 Stanford University, Stanford, CA 94305, USA
2 University of California, Berkeley, CA 94720, USA
Analyzing the toroidal field component from data collected by the Solar Dynamics Observatory/Helioseismic Magnetic Imager (SDO/HMI) and Wilcox Solar Observatory (WSO), we see signs of the next solar cycle have already appeared at high latitudes. WSO has provided data for the past four sunspot cycles, while HMI has been observing for six years.
We infer the direction of the toroidal field from the averaged difference in inclination away from radial for positive and negative field regions. This was first done for WSO in 19941 and extended in 20102. We have added HMI data and extended analysis through June 2016 seen in a prior update shown at the December 2015 AGU meeting.
To search for the 25th solar cycle, we determine inclination angles from the magnetograms from HMI and WSO. We use the observed line-of-sight magnetic field strength, track it for each Carrington coordinate as it crosses the disk, and fit it as a function of longitude from disk center to determine the east-west inclination. To reduce noise, the values are binned into regions, tracked daily and averaged over one year. The direction of the toroidal field at each latitude is then inferred from the sign of the difference in positive and negative inclinations. [1] saw that the average of leading polarity fields tilts back against the direction of rotation. i.e. the line-of-sight component of leading polarity regions are on average stronger toward the west limb and the following regions have stronger fields near the east limb when averaged over many rotations. The spatial averaging results in sensitivity to the large scale long-lasting field patterns. (Interpreting the average tilts as the toroidal field contains an implicit assumption that the toroidal flux tubes have about the same field strength at all longitudes for a given latitude.)
Figure 1 |The measured direction of the toroidal component fields from May 1976 to June 2016. The arrows and colors indicate the direction of the inferred east-west field. The color coding matches the inferred leading polarity fields with red and blue being negative and positive, respectively. The intensity of the color indicates the magnitude of the average tilt.
The toroidal component clearly shows the life of solar cycles (Fig. 1). After the maximum of one sunspot cycle, the next cycle starts at high latitude with toroidal field starting to change directions, which is demonstrated by changes in the signs of the leading and following polarities. Upon reaching the equator, the cycle reaches a minimum while the next cycle is at least four years old. The typical “11-year” cycle take approximately 16 years to move from high to low latitude.
Figure 2a (top), b (bottom) |The averaging of magnetogram data from May 2011 to May 2012 and May 2015 to May 2016, respectively. The magnetograms were from the hmi.M_720s series (12-minute magnetograms) centered at 5 UT to avoid “midnight” calibrations and the 24-hour variation in field strength present in HMI observations. The magnetograms were mapped to heliographic coordinates in a cylindrical equal area that was only remapped and averaged to 1229 EW and 972 NS bins. No field angle is assumed and did not correct for an assumed radial field.
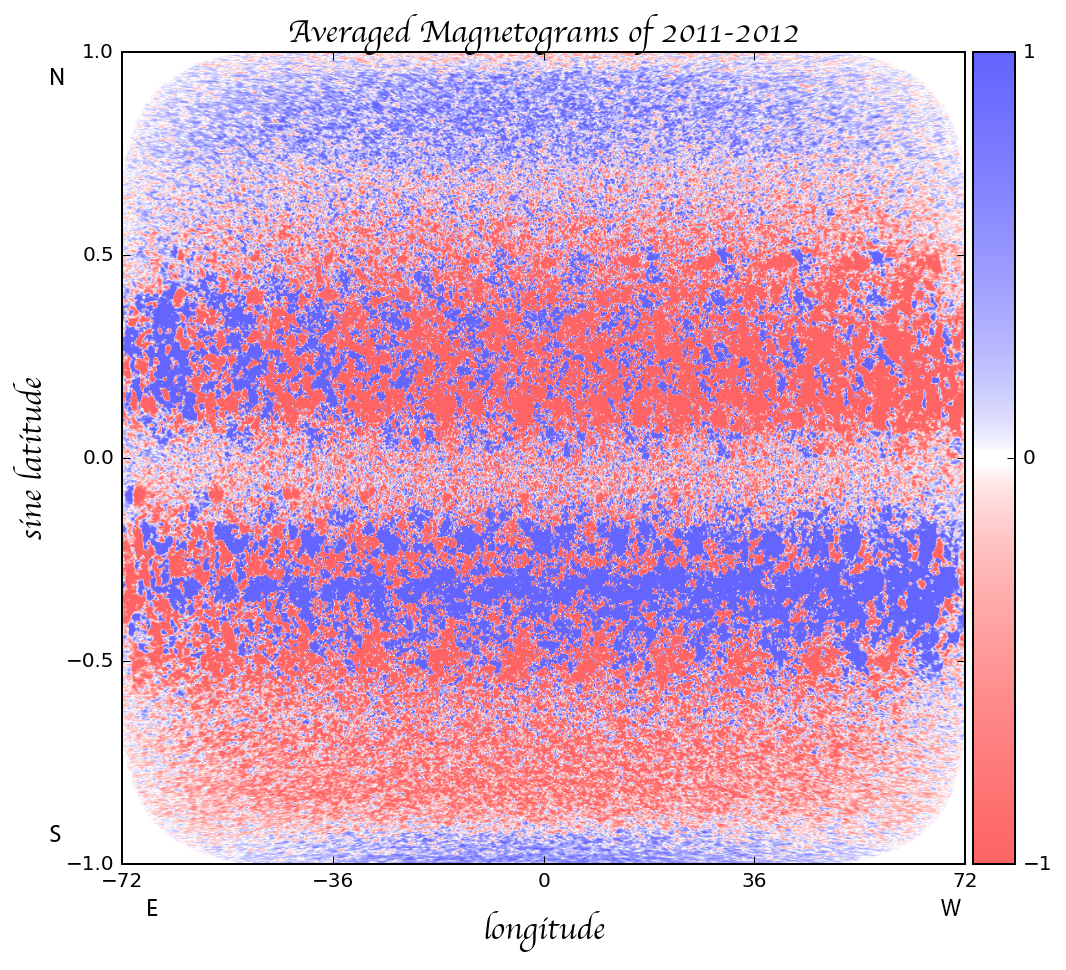
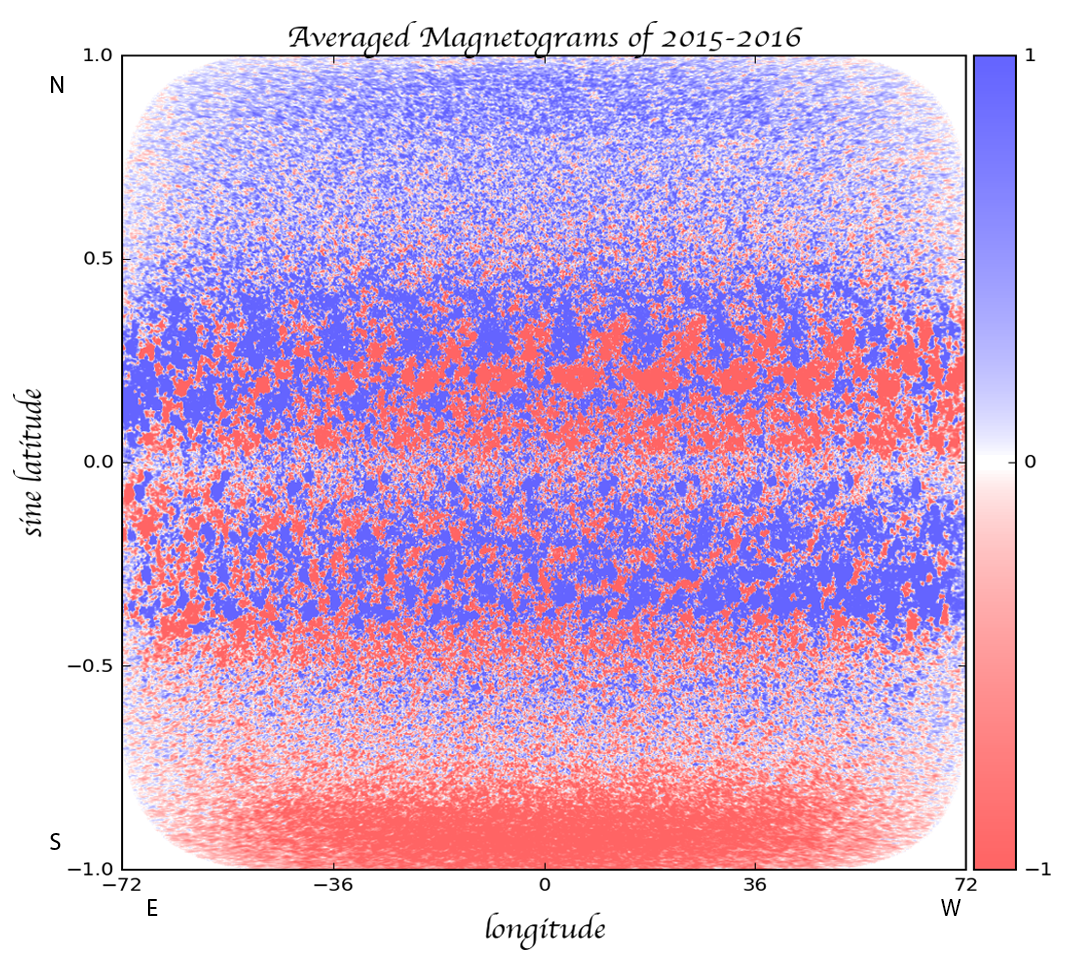
WSO observations are made with low resolution, the “pixels” are 3-arc-minute squares. While, HMI observations are made with about 130,000 pixels per WSO pixel. Since we search for the large-scale, long-lived, patterns we significantly average to reduce the effect of small-scale, rapidly changing fields of emerging magnetic regions. Note that in the active latitudes, the leading polarity fields are stronger toward the west limb and weaker toward the east limb. The opposite is true for following polarity fields. This indicates that the leading and following polarities, on average, are tilted toward each other. The polar fields nearly changed to match the following polarity in cycle 24 (Fig. 2a) and, in the south, the leading polarity (from stronger in the west than in the east) fields growing stronger (Fig. 2b). Note that the northern and southern hemispheres are evolving at different rates. Additionally, the amount of regions of high intensity rapidly evolving magnetic fields that is both present and not removed in the first level averaging (Fig. 2) is the source of noise during solar cycle maximums at lower latitudes (Fig. 3).
Figure 3 |Figure 3 shows the same analysis that was done to the WSO data. i.e. we fit for the difference between tilts in the two polarities. The result was smoothed with a 2-pixel by 3-pixel bin FWHM Gaussian to approach WSO resolution.
Both Figures 1 and 3 show the start of Cycle 25 at high southern latitudes. This combined with prior reports that the polar field strength at least in the south is similar to polar field strength at the past minimum in c. 2008 data confirms that Cycle 25 exists and will likely have a strength similar to Cycle 24.
References
[1] Shrauner, J.A., Scherrer, P.H., 1994, Solar Phys, 153, 131, (DOI: 10.1007/BF00712496)
[2] Lo, L., Hoeksema, J.T., Scherrer, P.H., ASP Conf. Series. 428, (2010ASPC..428..109L)
Yes, i am also know that it was first observed and discussed by Howard
I found a theory to calculate the lowest sunspot number between sunspots
This toroidal component was first observed and discussed by Howard (Solar Phys. 39, 275, 1974), Svalgaard et al. (Solar Phys. 58, 225, 1978) and Duvall et al. (Solar Phys. 61, 233, 1979).