229. Source-Region Magnetic Evolution and Precursors of the X9.0 Flare in Solar Cycle 25
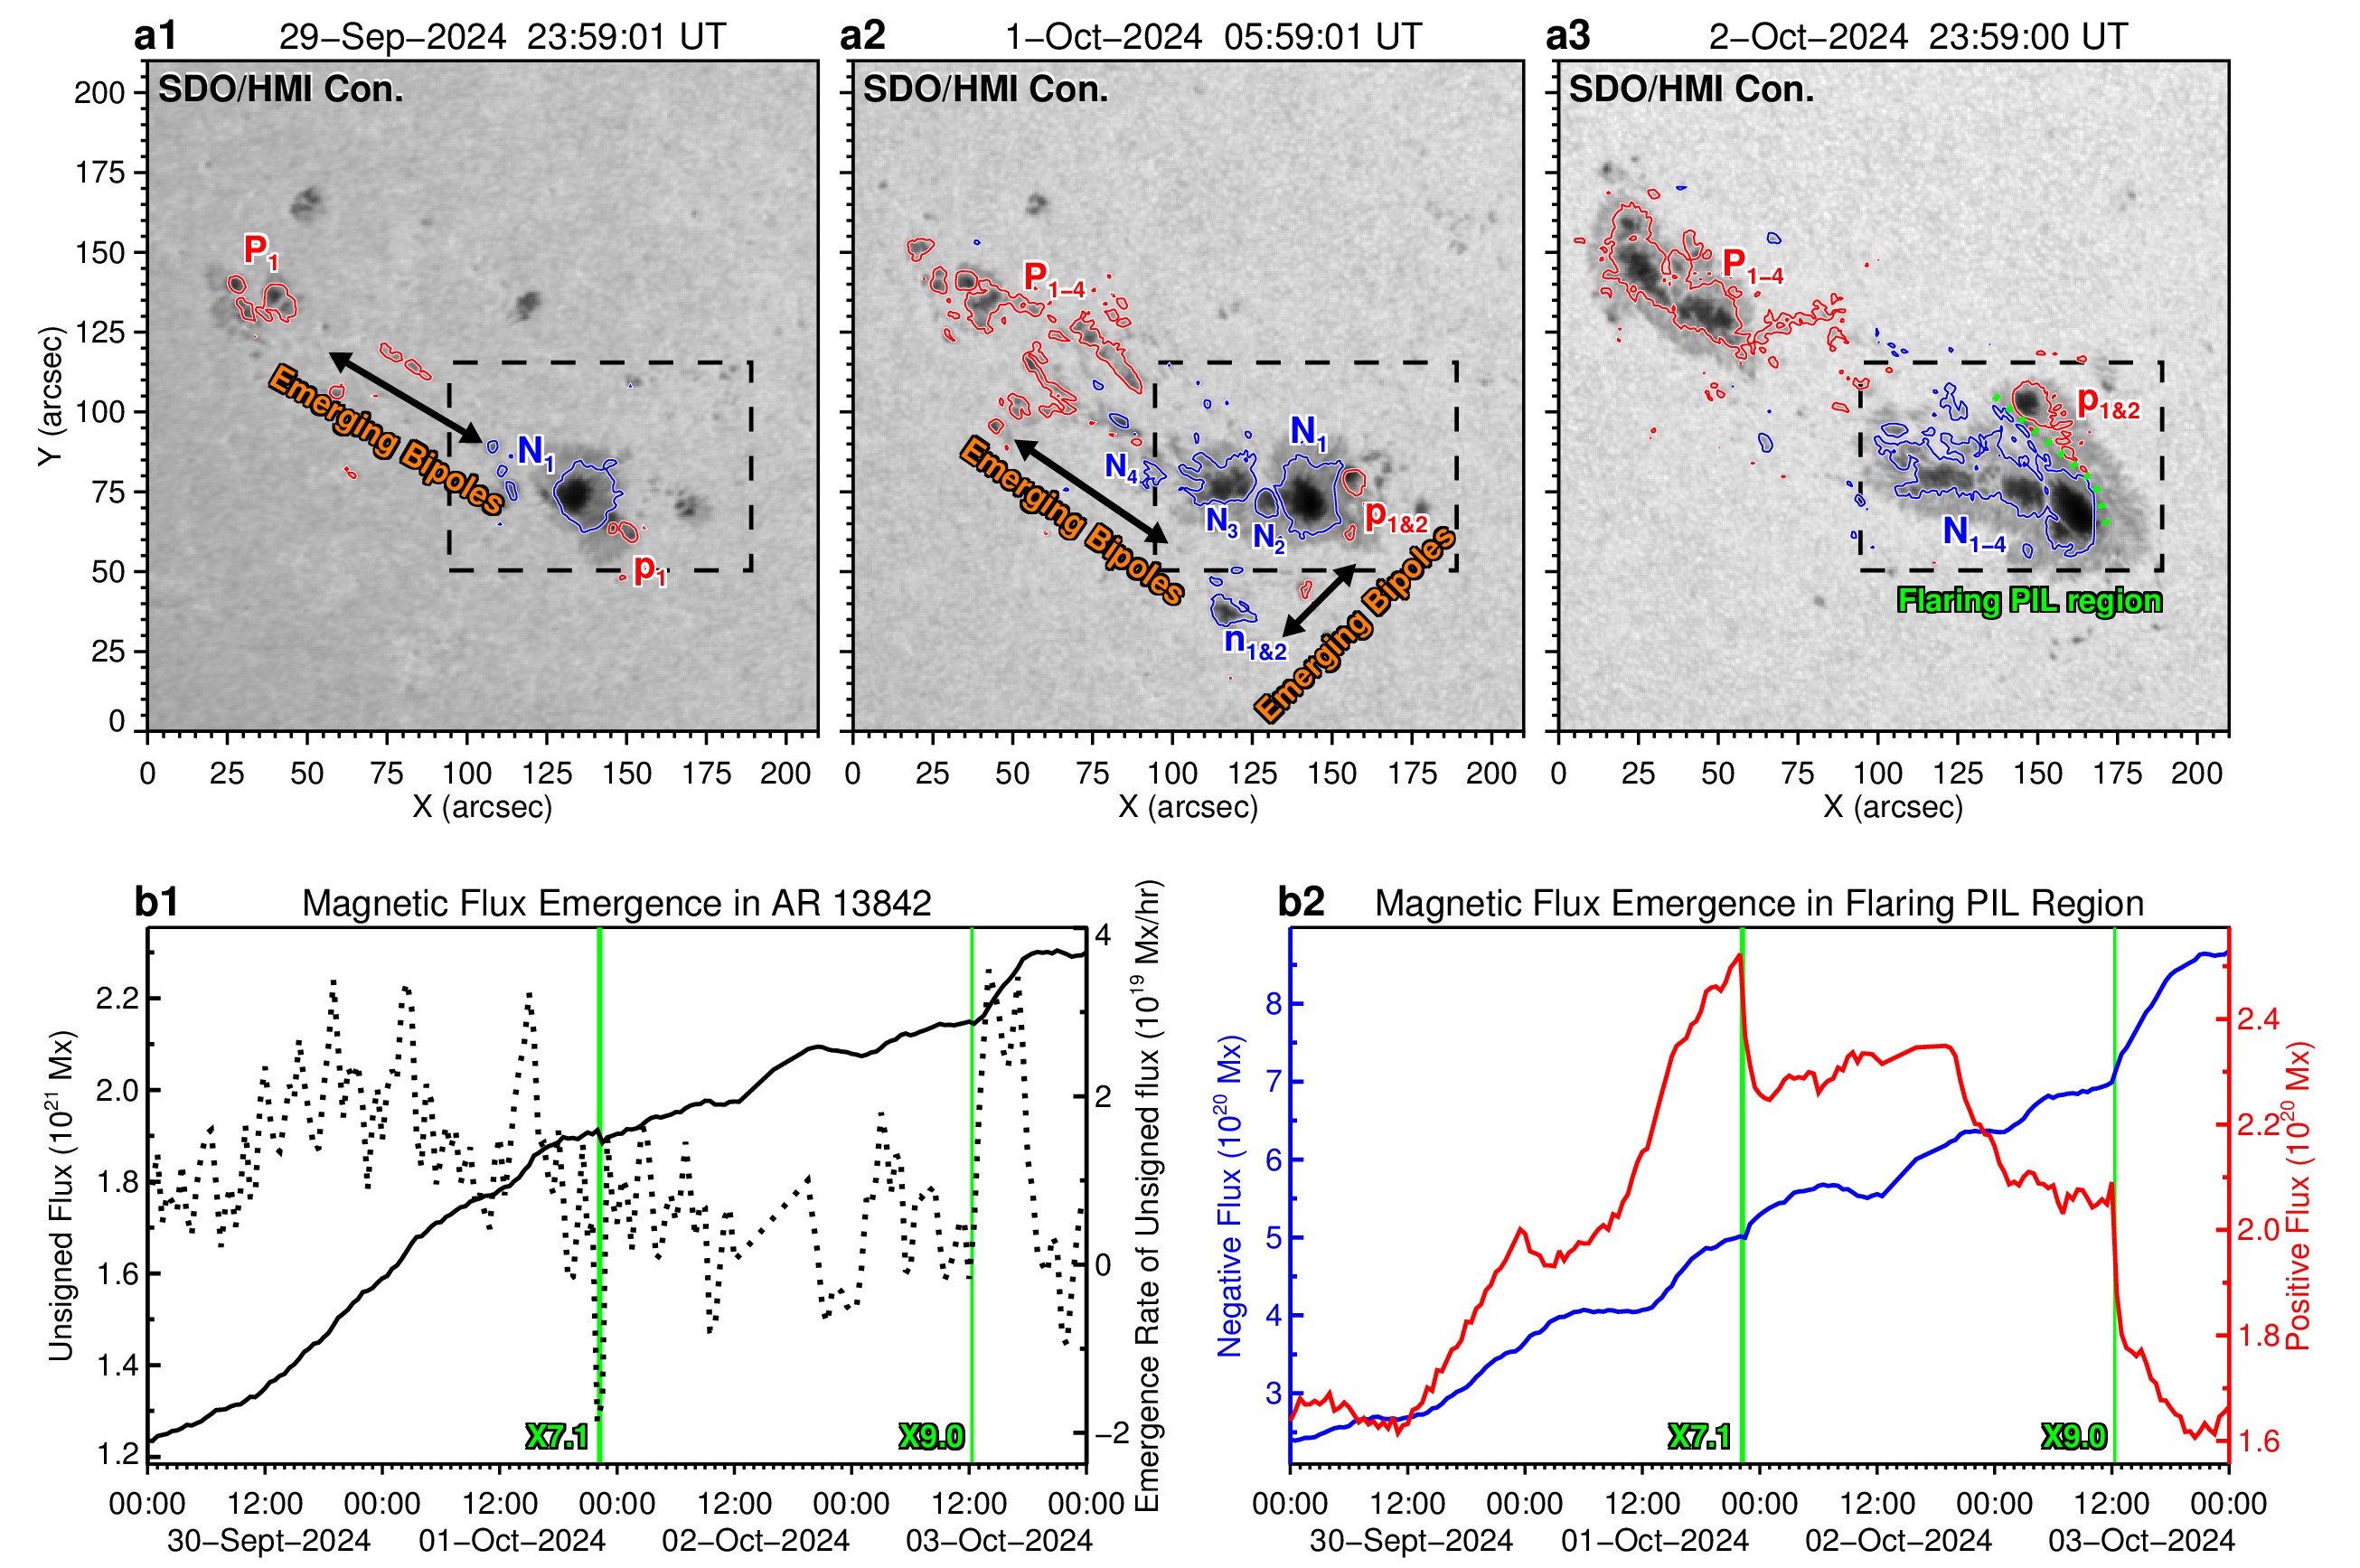
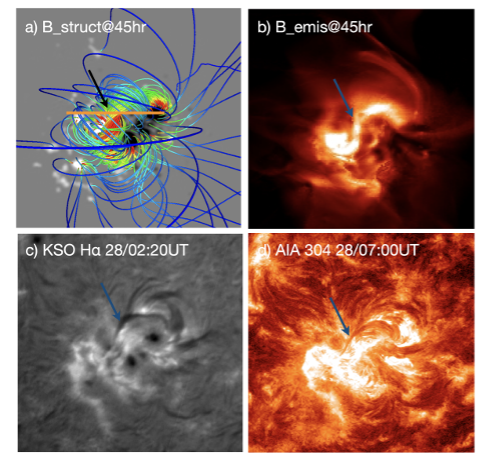
Persistent magnetic flux emergence with perpendicular separation directions in AR 13842 rapidly formed a collisional shearing PIL, with frequent flux cancellations there, leading to repeated magnetic flux rope formations and multiple large flares. The pre-flare decreases in the sheared PIL’ s area and free-energy density may serve as a promising precursor for major eruptive flares.