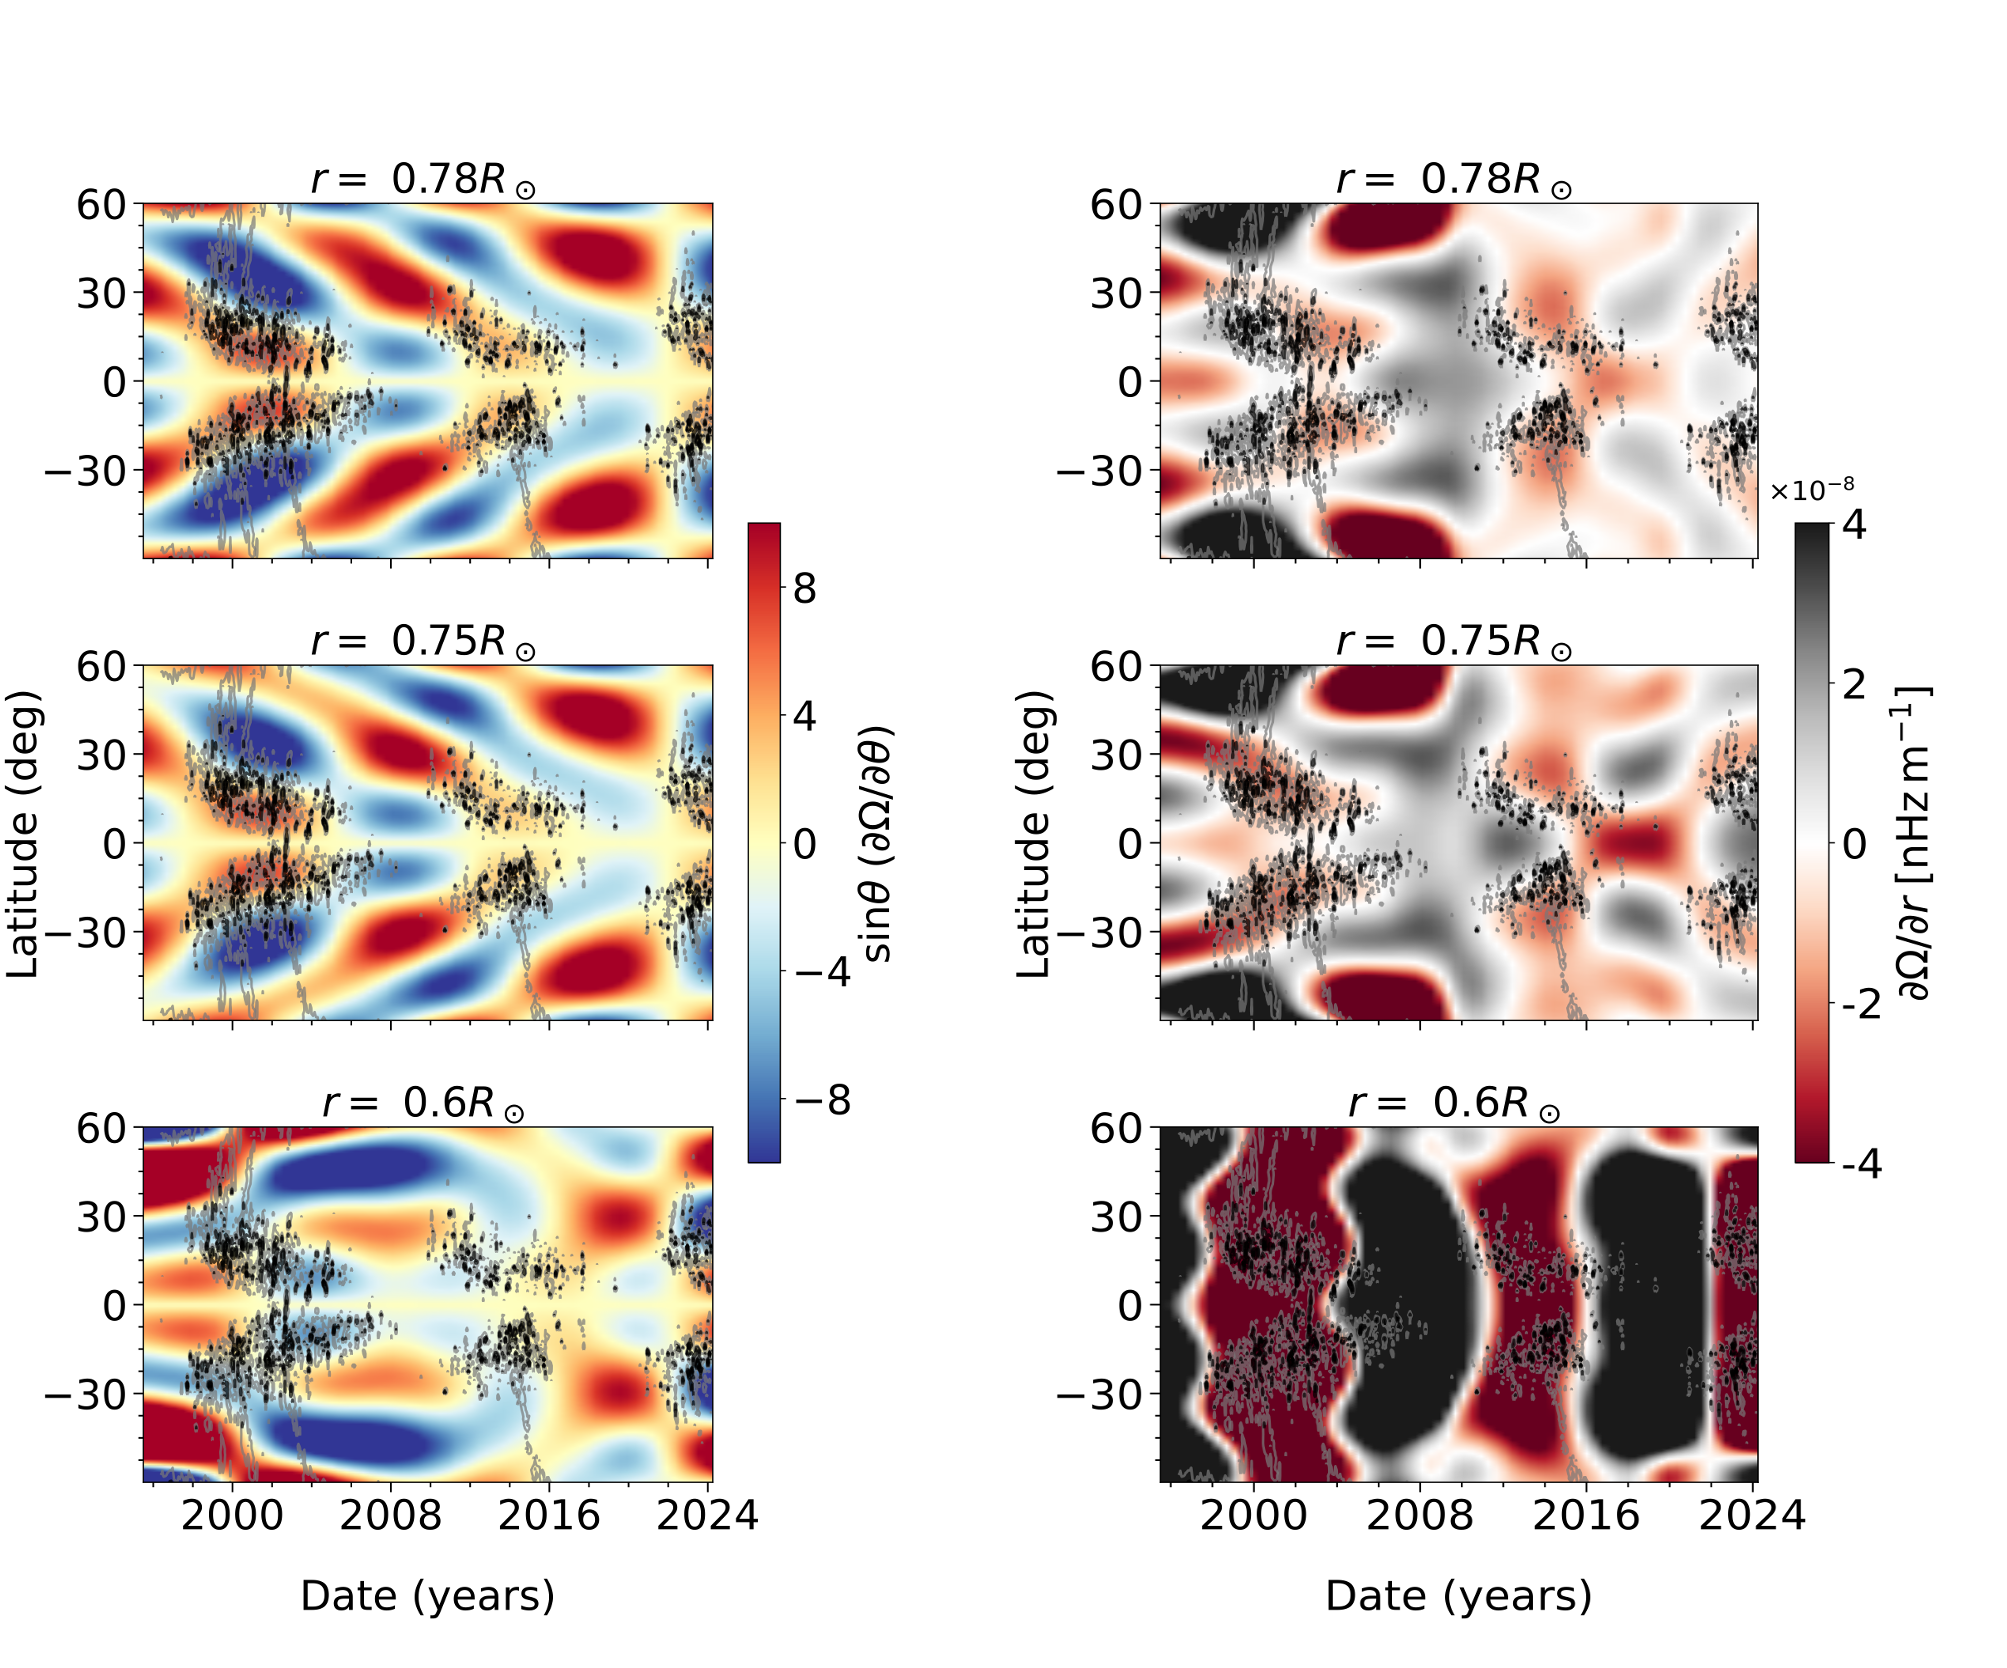
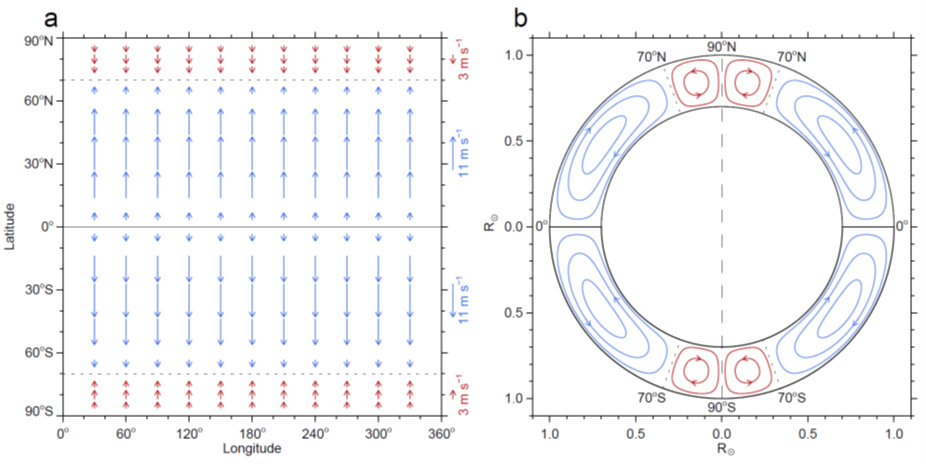
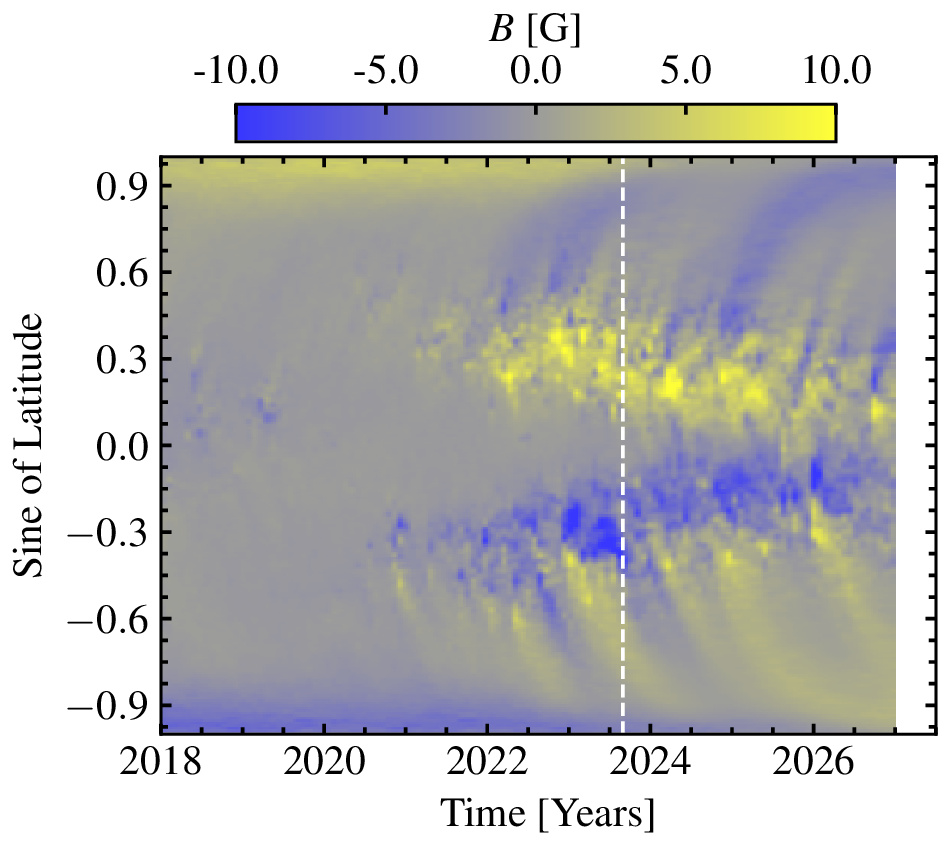
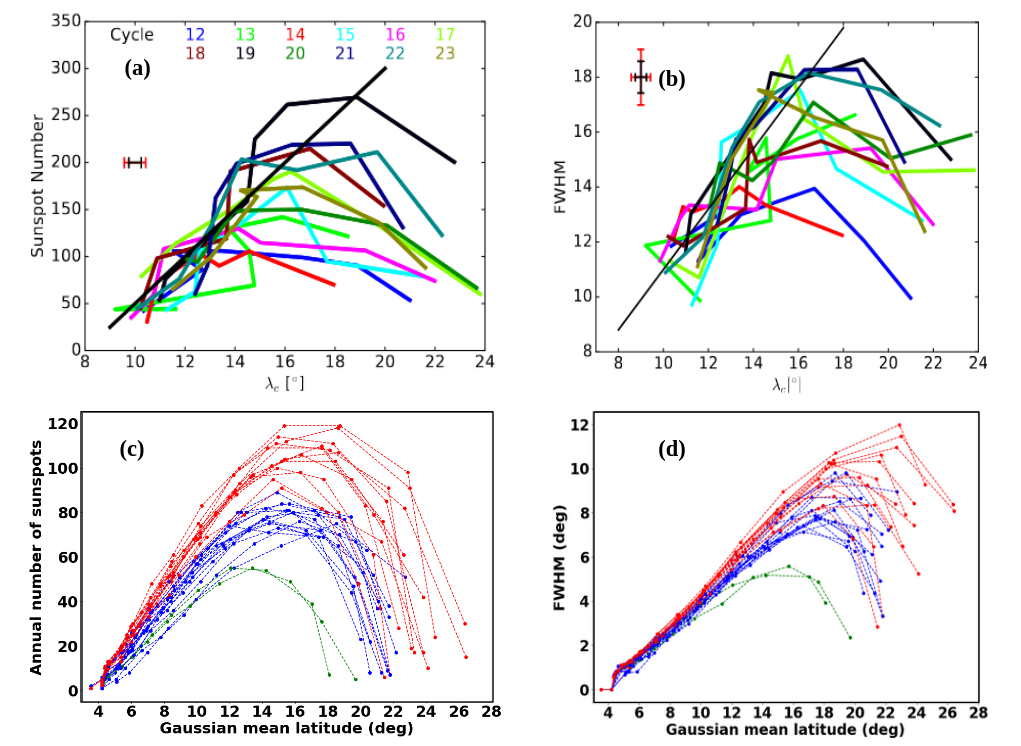
227. Diverging subsurface flows beneath active regions dominate magnetic flux transport on the Sun
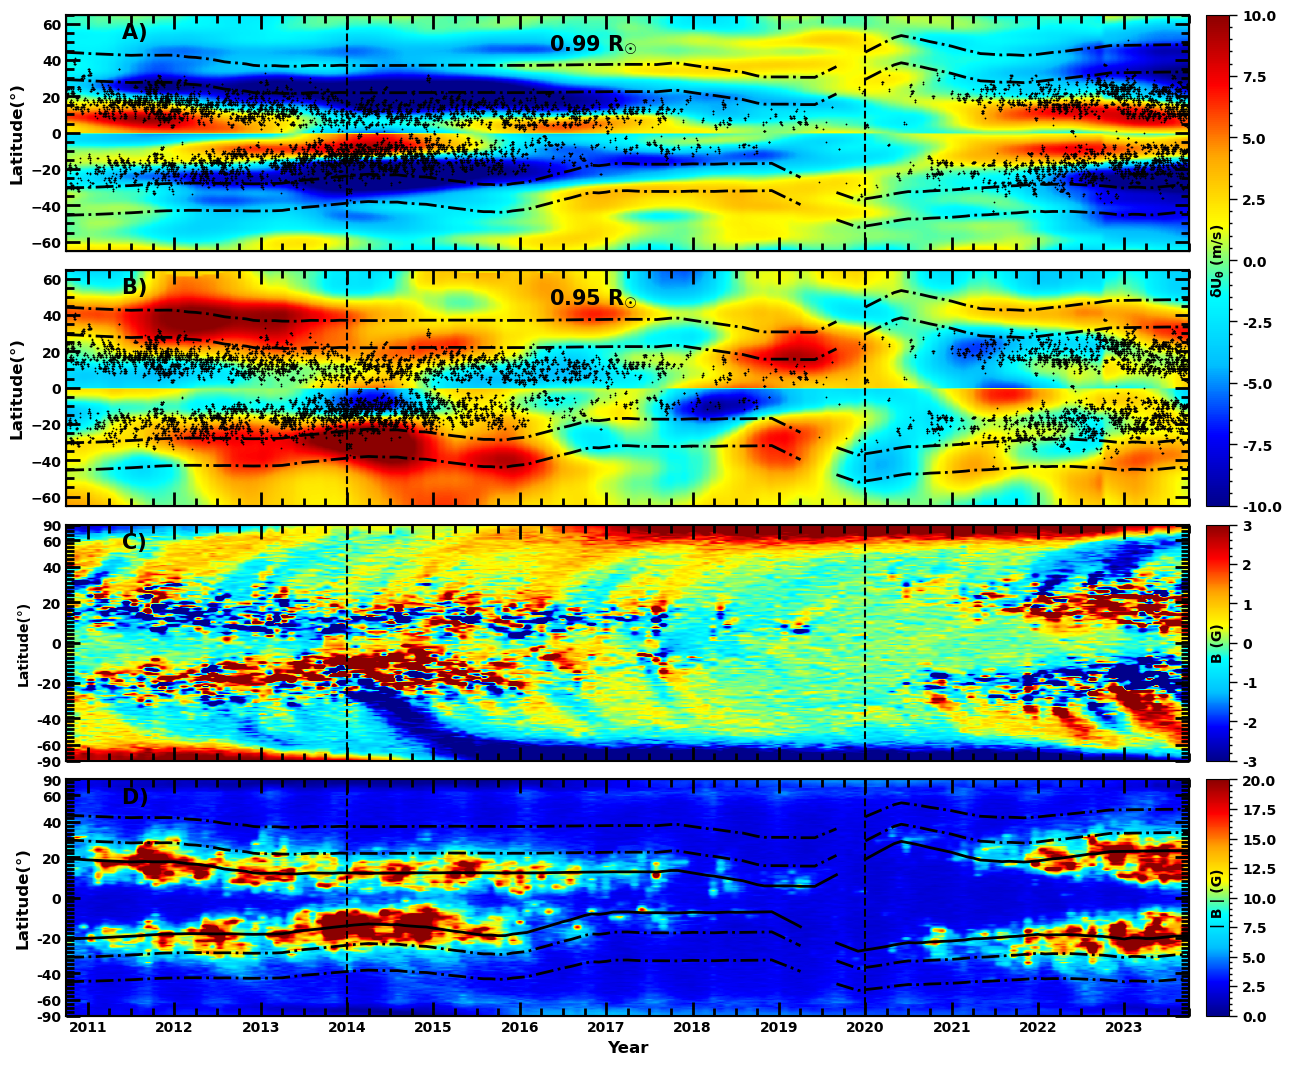
Using 14 years of helioseismic and magnetic-field observations, this study shows that deeper subsurface outflows from active regions play an important role in transporting magnetic fluxes to the polar regions and regulating polar-field formation.