
J. A. Guerra1,*, S.-H. Park1, P. T. Gallagher1, I. Kontogiannis2, M. K. Georgoulis2, D. S. Bloomfield3
1. School of Physics, Trinity College Dublin, Ireland.
2. Research Center for Astronomy and Applied Mathematics (RCAAM), Academy of Athens, Greece.
3. Northumbria University, Newcastle upon Tyne, UK.
* Now at Physics Department, Villanova University, PA, USA.
The majority of flare forecasting methods rely on observations of the magnetic field on the Sun’s surface. In particular, a great historical importance has been given to the normal-to-surface component, Bn, because it represents the value at the boundary of a magnetically-structured volume that encompasses the corona of active regions (ARs). Data products such as the Spaceweather HMI Active Region Patches[1], or SHARPs, provide in near-real time AR cutout maps with two approximations to Bn: the line-of-sight component Blos(LOS – if viewing-angle corrected) and the cylindrical equal area (CEA) radial component, Br. For projects such as the Flare Likelihood and Active Region Eruption foreCASTing ( flarecast.eu), that uses SHARP data for machine-learning-based flare forecasting, it is important to know what the differences are between AR magnetic properties derived from Blos and Br measurements before they are used as predictors.
The effects of using Blos or Br was studied for six AR magnetic properties: 1) Schrijver’s R value, Log(R); 2) the Fourier power spectral index, α; 3) the summed length of all polarity inversion line (PIL) segments, Ltot; 4) the maximum ratio of PIL length to minimum height of critical decay index, (L/nmin)max; 5) the effective connected magnetic field strength, Beff; 6) the Ising energy, Eising. A sample of approx. 4000 SHARPs associated to single NOAA regions was randomly selected for calculating these properties. The difference in value, variations with the region position, and variations on the properties’ flaring association statistics were studied.
Figure 1|. In this figure the properties values of Ltot, α, and Beff calculated with both components are shown. Panels a,c,e display scatter plots for properties in the Br-derived vs Blos-derived space. Black, blue, and red data points correspond to SHARPs located in longitude ranges of 0°-60°, 60°-75°, and 75°-90°, respectively. The solid black line represents unity, the grey solid and grey dashed lines mark the average and standard deviation of the difference (Br – Blos) distribution, respectively. Panels b,d,f display the differences between the Br-derived and Blos-derived property values as a function of the SHARP location.
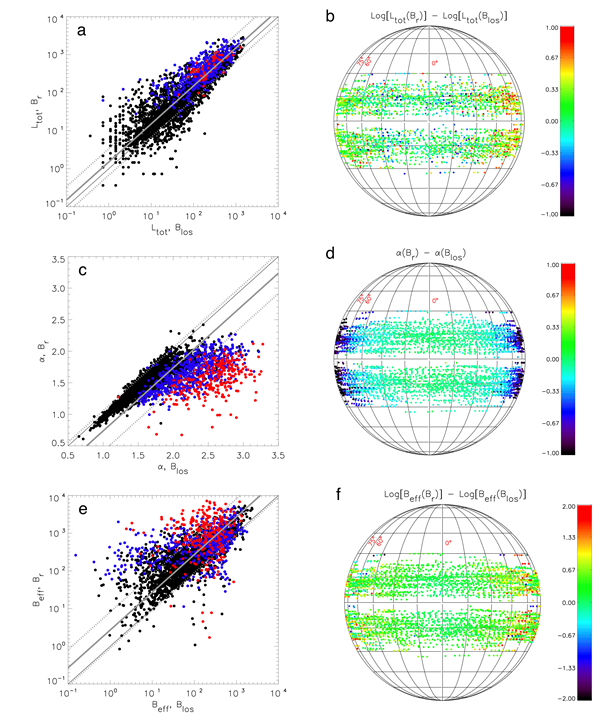
All of the studied properties except α showed higher values when calculated from Br – scatter plots of Br-derived value vs Blos-derived value for Ltot and Beff (Figure 1a,e) show that the spread of points around the unity line (solid black) is distributed with a positive average (grey line). This results from a systematic underestimation of field strength by the Blos component (approximately 25 – 30% for field strengths > 1.5 kG), which does not show a strong dependence with the AR longitudinal position. Although most SHARPs show a very similar value when derived from Blos and Br (difference ≈ 0; green points on Figures 1b,d,f), there are some cases for which non-zero differences are already observed at longitudes greater than just 45°. The small East-West asymmetry of red data points in Figures 1b,d,f results from the spatio-temporal patterns of noise associated to HMI measurements of Br[2]. In opposition, Blos systematically produces higher values of the Fourier power spectral index (Figure 1c). When observing their dependence with the SHARP location, it is clear that Br basically corrects the Blos-calculated values by reducing the values of those located at > 45°.
Figure 2| Flaring association for three of the studied properties: (a) Ltot, (b) α, (c) Beff. Flaring rates correspond to the average number of flares of C-class intensity or above (C1.0+) observed in a 24-hour window after the observation time. Top and bottom panels in each plot correspond to Blos– and Br-derived property values, respectively.
Since using different magnetogram data results in different property values for the same observation time, the associated flaring rate is affected accordingly. Figure 2 shows the average 24-hour flaring rates as function of property values for those properties shown in Figure 1. Most properties show the tendency of flaring rates increasing with increasing property value. The uncertainty increases as well, meaning that less flare events are observed for such range. When using Br, these rates show larger ranges implying that the resolution of flare-associated property values is increased.
The results of this investigation show that the radial component seems to provide better estimates for properties far from the central meridian, and at the same time it provides more independent information by reducing correlations between pairs of properties (not shown here). Therefore, keeping in mind the viewing-angle bias associated to the LOS component, the use of Br in calculating magnetic properties in ARs seems recommended. For determining which of these two components might produce more accurate flare forecasts, a different study involving a validation procedure should be implemented.
For further detail on this work, please refer to:
Guerra, J.A., Park, SH., Gallagher, P.T. et al. (2018) Sol. Phys., 293, 9. https://doi.org/10.1007/s11207-017-1231-z
References
[1] Bobra, M.G., Sun, X., Hoeksema, J.T. et al. 2014, Sol. Phys., 289, 3549
[2] Hoeksema, J.T., Liu, Y., Hayashi, K. et al. 2014, Sol. Phys., 289, 3483