
Zhi-Chao Liang1, Laurent Gizon1,2,3, Aaron C. Birch1, and Thomas L. Duvall, Jr.1
1 Max-Planck-Institut für Sonnensystemforschung, Justus-von-Liebig-Weg 3, 37077 Göttingen, Germany
2 Institut für Astrophysik, Georg-August-Universität Göttingen, Friedrich-Hund-Platz 1, 37077 Göttingen, Germany
3 Center for Space Science, NYUAD Institute, New York University Abu Dhabi, PO Box 129188, Abu Dhabi, UAE
Introduction
Recently, Löptien et al.1 reported a direct and unambiguous detection of Rossby waves at the surface and in the outer 20 Mm of the Sun. They applied both granulation-tracking and ring-diagram analysis on six years of SDO/HMI data to measure horizontal flows, and found waves of radial vorticity propagating along the equator in the retrograde direction in the corotating frame. The dispersion relation of these waves is consistent with that of classical sectoral Rossby waves for a star rotating at constant angular velocity Ω (see, e.g., Ref. [2]):
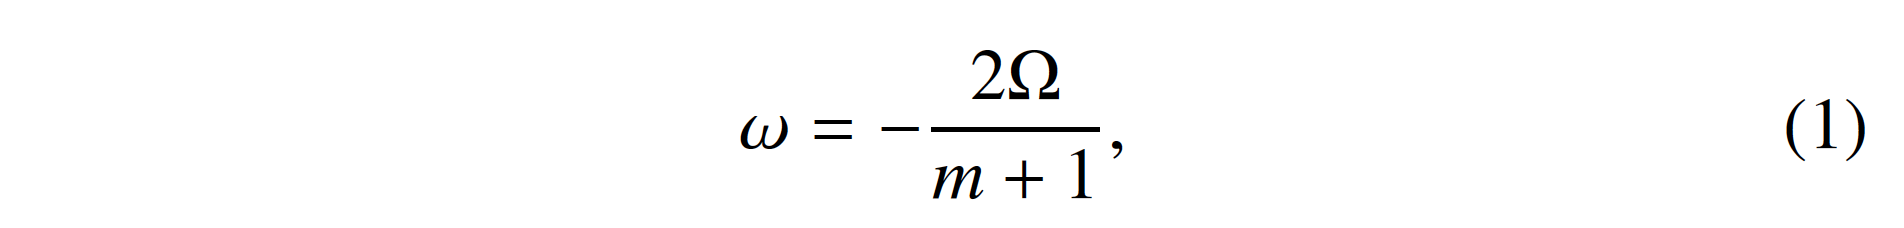
where m is the azimuthal wavenumber in the range of 3 ≤ m ≲ 15. In Ref. [3], we applied a different technique, time-distance helioseismology4, to the combined SOHO/MDI and SDO/HMI Doppler-velocity data sets in order to provide an independent confirmation of these findings.
Data analysis
Figure 1| Schematic plot of acoustic ray paths (red lines) that connect pairs of points across the equator in a meridional plane. The travel-time difference between the southward and northward propagating acoustic waves is sensitive to the north-south flow along the ray path. The larger the angular distance between the observation points at the surface, the deeper the lower turning point of the rays.
Since the displacement of sectoral Rossby waves at the equator is solely in the north-south direction (see Ref. [2] for sketches of the flow field), we measured the acoustic travel-time shifts in the north-south direction around the equatorial area, which are sensitive to subsurface meridional flows across the equator as depicted in Fig. 1. The travel times were measured in a frame rotating at Ωeq/2π = 453.1 nHz (as done in Ref. [1]), which is the solar surface equatorial rotation rate in the sidereal frame. The measurements were made each day using 14-yr of MDI data and 7-yr of HMI data that cover a total of 21 years from May 1996 to April 2017. The travel distances used in this work range from 6◦ to 30◦. We averaged the travel times over all travel distances in this range to reduce the noise (the mean distance corresponds to a lower turning point of 0.91R⊙ for the acoustic waves). The resulting travel-time shifts are a function of longitude and time.
Power spectra
We split the 21-yr travel-time measurements into three subsets of seven years and performed 2D Fourier transforms to obtain the power spectra, which are a function of azimuthal wavenumber m and angular frequency ω. Since the measurements only cover a fraction of the Sun (within ±50◦ from the central meridian), there is spatial leakage to the neighboring m due to the window function. The window function moves in longitude at a rate of (Ωeq − Ω⊕)/2π = 421.41 nHz in the chosen frame (see Fig. 2), where 2π/Ω⊕ = 365.25 days is Earth’s mean orbital period; therefore, the spatial leakage is shifted by m × 421.41 nHz.
Figure 2|Section of the window function W(ϕij, tj) in the frame that rotates at Ωeq/2π = 453.1 nHz, where the longitudes of the measurements at time tj are denoted by ϕij and i ∈ {−5, −4, . . . , 5} (11 measurements at intervals of 10◦ along the equator each day). The window function is equal to one for i ∈ {−4,…4}, one half at the boundaries i = ±5, and zero elsewhere. The window function is also zero for missing data. The temporal periodicity of the window is 2π/(Ωeq − Ω⊕) = 27.46 days.
Figure 3 shows the power spectra of north-south p-mode travel-time shifts measured in the corotating frame. The power spectra from three different periods all show peaks around the eigenfrequencies of Rossby waves for sectoral modes with 3 ≤ m≲15. The ridge structure of the Rossby modes becomes more prominent after averaging over the three time periods. The other ridges of power seen in Fig. 3, which are separated from the central ridge by ±421.41 nHz with a reduced amplitude, are leaks from the Rossby modes due to the convolution with the window function in Fourier space. Excess power at low frequencies is present at low m, which also leaks and modulates the spectrum at frequencies between −300 and −500 nHz; the low-frequency power might be caused by large-scale convection or local flows around active regions that corotate with the Sun.
Figure 3|Power spectra of north-south travel-time shifts measured in the frame rotating at Ωeq/2π = 453.1 nHz. Panels (a) to (c) show power spectra from three time periods. Panel (d) shows the mean spectrum over the three periods (seven years each). The blue lines highlight the dispersion relation of the classical sectoral Rossby waves described in Eq. 1 with Ω = Ωeq. The orange ellipse marks the excess low-frequency power at low m and the purple ellipse marks the spectral leakage from the low-frequency power. The gray scale is the same for the four panels and is shown in the bar on the right.
Conclusion
We used time-distance helioseismology to confirm the existence of global-scale equatorial Rossby waves over the last two solar cycles (21 years of data, MDI and HMI), for deeper layers (down to ∼63 Mm).
Reference
[1] Löptien, B., Gizon, L., Birch, A. C., et al. 2018, Nature Astronomy, 2, 568
[2] Saio, H. 1982, ApJ, 256, 717
[3] Liang, Z.-C., Gizon, L., Birch, A. C., & Duvall, T. L. 2019, A&A, 626, A3
[4] Duvall, Jr., T. L., Jefferies, S. M., Harvey, J. W., & Pomerantz, M. A. 1993, Nature, 362, 430