
Scott W. McIntosh1, Xin Wang1,2, Robert J. Leamon3 & Philip H. Scherrer4
1High Altitude Observatory, NCAR, P.O. Box 3000, Boulder, CO 80307
2School of Earth and Space Sciences, Peking University, Beijing, 100871, China
3Department of Physics, Montana State University, Bozeman, MT 59717
4W. W. Hansen Experimental Physics Lab, Stanford University, Stanford, CA 94305
Line-of-sight magnetograms from the HMI/SDO are analyzed using a diagnostic known as the “Magnetic Range of Influence,” or MRoI. The MRoI is a measure of the length over which a photospheric magnetogram is balanced and so its application gives the user a sense of the connective length scales in the outer solar atmosphere [1]. Figure 1 illustrates how the magnetic range of influence, or MRoI, is constructed from a line-of-sight magnetogram in a pixel-by-pixel fashion and is defined as the (radial) distance the pixel over which the total signed flux of the enclosed region is zero. The MRoI is a measure of magnetic balance, or the effective length scale over which we would expect the overlying corona to be connected, or closed.
Figure 1| The full-disk HMI line-of-sight magnetogram (A) and derived “Magnetic Range of Influence” (MRoI; B) map from May 16 2010.
The MRoI maps and histograms inferred primarily exhibit four scales: a scale of a few megameters that can be associated with granulation, a scale of a few tens of megameters that can be associated with super-granulation, a scale of many hundreds to thousands of megameters that can be associated with coronal holes and active regions, and a hitherto unnoticed scale that ranges from 100 to 250 megameters, see Figure 2 and [2].
Figure 2| Histogram of MRoI values versus those of a “null” experiment of randomized realizations. Four possible scale ranges are observed: one near the resolution limit of HMI at a few Mm (red dashed line), the majority of the pixels show a scale of ~30Mm (blue dashed line), a third component peaking at ~125Mm scale (green dashed line), and a group of scales around 1000 Mm. The gray shaded ensemble of null MRoI histograms show none of the same characteristic scales. The MRoI has a hard limit of a solar diameter (vertical thin dashed line) imposed.
We infer that this final scale is an imprint of the (rotationally-driven) giant convective scale on photospheric magnetism. This scale appears in MRoI maps as well-defined, spatially distributed, concentrations that we have dubbed “g-nodes”. Giant cells are hypothesized to reach the bottom of the convective interior and span 100–200 Mmin diameter [3,4], but they have remained an
elusive quarry to the observer[5].
Furthermore, using coronal observations from the Atmospheric Imaging Assembly (AIA) on SDO, we see that the vicinity of these g-nodes appears to be a preferred location for the formation of extreme ultraviolet (EUV, and likely X-Ray) brightpoints, see Figure 3. These observations and straightforward diagnostics offer the potential of a near-real-time mapping of the Sun’s largest convective scale, a scale that
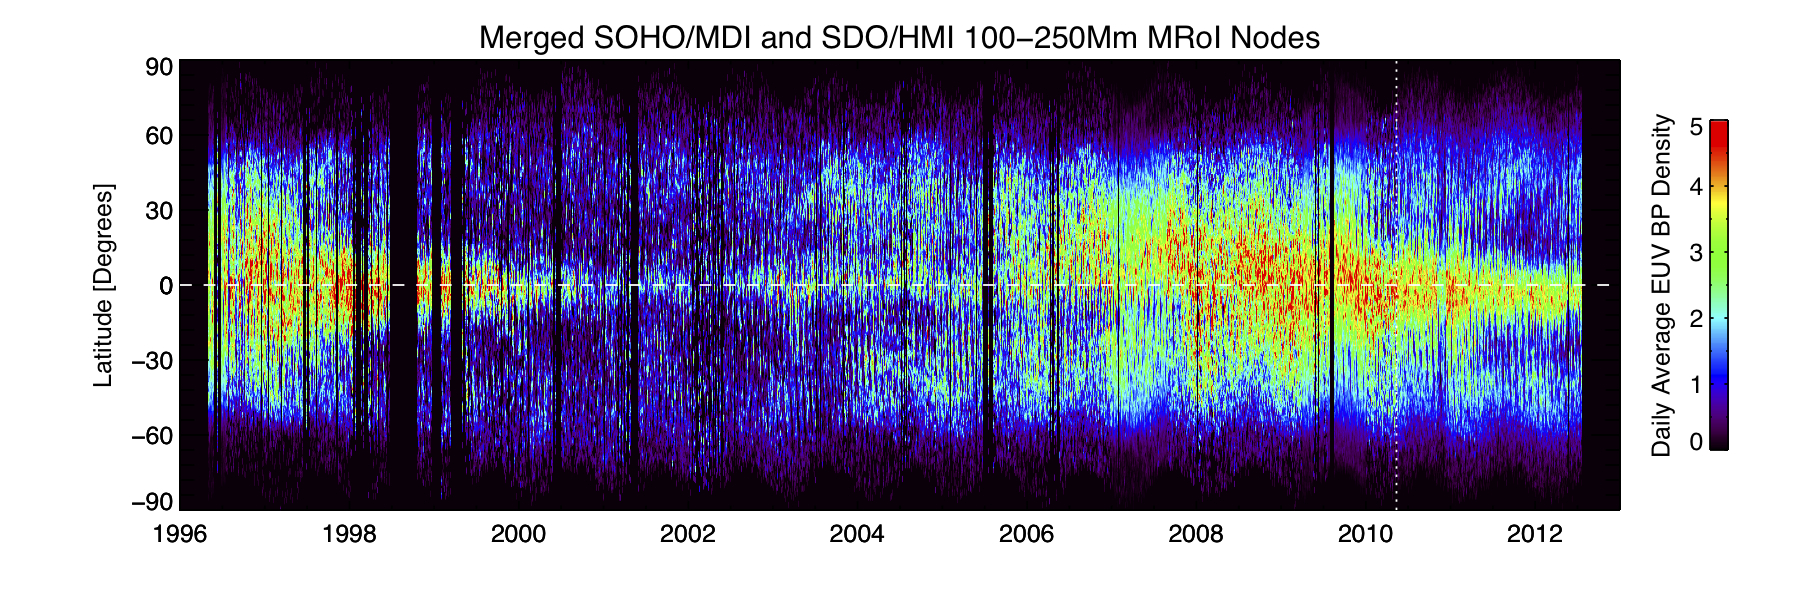
Figure 3|.The latitude-time distribution of g-node densities from the SOHO/MDI and HMI instruments — a g-node butterfly diagram. The features in this plot are numerous, including: the appearance of bands of g-nodes, “dark patches” where active regions and coronal holes (spatially extended regions of large MRoI — see Figure 1) obscure g-nodes at times in lower latitudes, the profound lack of g-nodes above 55 degrees latitude. All of which are future avenues for exploration.
We have seen that the quiescent photospheric magnetic field is composed of multiple connective scales. The observed scales range from a few megameters to those that are 100 –250 Mm in scale. We expect that the latter of these scales belongs to a spatially large, deep and hence slowly overturning convective flow — one that possibly reaches to the bottom of convection zone. Further, it would appear that photospheric line-of-sight magnetograms (and Dopplergrams) carry information about these nested scales in a non-trivial spatial mixture. It follows that the two cannot be easily disentangled without employing a technique like the MRoI. However, the ready visibility of a giant convective scale and its relatively straightforward identification could have a significant bearing on our ability to probe the variations of the deep solar interior and its long-term evolution.
References
[1] McIntosh, S.W., Davey, A.R., & Hassler, D.M. 2006, Astrophys. J. Letters, 644, L87
[2] McIntosh, S.W., Wang, X., Leamon, R.J., Scherrer, P.H., 2014, Astrophys. J. Letters, 784, L32
[3] Miesch, M. S. 2005, Living Reviews Solar Phys., 2, 1
[4] Nordlund, Å., Stein, R. F., & Asplund, M. 2009, Living Reviews Solar Phys., 6, 2.
[5] Beck, J. G., Duvall, T. L., & Scherrer, P. H. 1998, Nature, 394, 65