
David Hathaway1, Lisa Upton2,3
1 NASA Marshall Space Flight Center, Huntsville, AL 35812, USA
2 Vanderbilt University, Nashville, TN 37235, USA
3 The University of Alabama, Huntsville, Huntsville, AL 35899, USA
The Sun’s equator rotates more rapidly than its polar regions – once every 24 days at the equator and once every 35 days at the poles. This behavior is the opposite to what we might expect from the conservation of angular momentum. If we take fluid from the Sun’s equator and move to the poles then it should spin up the same way an ice skater spins faster when she pulls her arms in closer to her rotation axis.
It was recognized decades ago that the Sun’s rapidly rotating equator could only be maintained if there were forces or stresses that could act against this tendency to make the poles spin faster. The source of these forces or stresses had to have two key requirements: its structure could not be axisymmetric and it had to be highly influenced by the Sun’s rotation. Giant cells– very large (non-axisymmetric) convection cells with lifetimes longer than the Sun’s rotation period – were proposed to be the solution.
Early computer models of large convection cells in the Sun’s convection zone (the outermost 30% of the Sun by radius) indicated that giant cells could indeed maintain the Sun’s rapidly rotating equator by producing a “Reynolds stress” – a correlation between flows in the direction of rotation with flows toward the equator (see e.g. Gilman1).
The possible existence of giant cells was first proposed by Simon and Weiss2 in 1968 shortly after the discovery of supergranules. Supergranules are convection cells 30,000 km across – 30-times larger than the previously known granules. Supergranules are big, but not big enough. Their lifetimes of about a day are far too short compared to the Sun’s average 27-day rotation period for them to be highly influenced by the Sun’s rotation.
Over the intervening 45 years there have been many searches for giant cells and several tantalizing, but inconclusive, observations. This impasse was recently overcome by an analysis we (Hathaway, Upton, and Colegrove3) did of data from HMI.
HMI Doppler velocity data averaged over 12-minutes clearly shows the cellular pattern produced by supergranules (Figure 1A). We tracked the motions of groups of supergranules by measuring the distance the groups moved over the course of 8 hours and then repeated those measurements for the same patch on the surface of the Sun every hour over the 13 days that the patch can be seen.
The average of these velocity measurements at a given location is dominated by the differential rotation and meridional flow – the axisymmetric flows. Once these flows are removed we find an underlying pattern of cellular flows (Figure 1B) that satisfy the requirements for giant cells: 1) the flows are cellular (non-axisymmetric); 2) the cells are large – 100,000 km across by as much as 500,000 km long; 3) the cells are long-lived – up to six months or more (Figure 2); 4) the flows are highly influenced by the Sun’s rotation with clockwise flows around high pressure outflows in the north and counter-clockwise in the south; and 5) the flows have the expected Reynolds stress – faster rotating fluid is moving toward the equator!
Figure 1 | Supergranules (A) as revealed by their Doppler velocity signal (blue indicates flows toward HMI, red indicates flows away from HMI). Note that the flows in supergranules are largely horizontal so the line-of-sight Doppler signal gets very weak at disk center. Giant cells (B) as revealed by tracking the motions of supergranules (blue indicates longitudinal velocities slower than the average rotation rate at that latitude, red indicates faster longitudinal velocities). The vectors plotted in (B) indicate the flow direction.

A movie of the giant cell flows can be seen seen below:
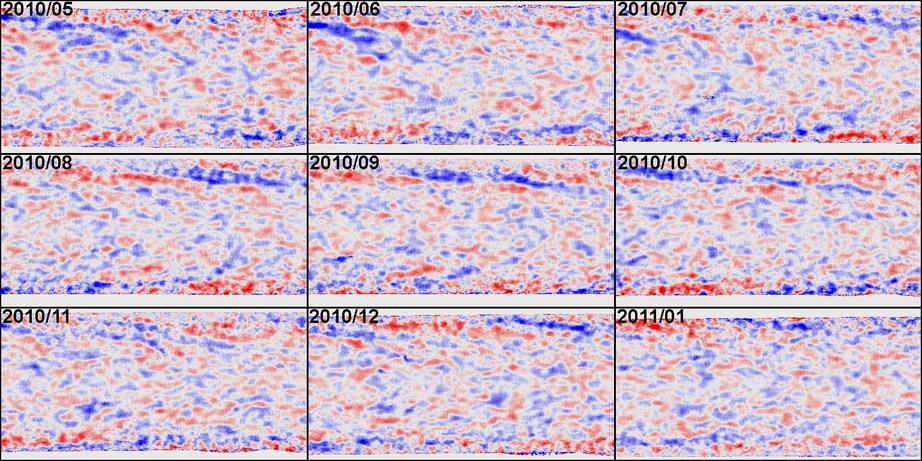
When we construct maps of these flows using longitudes tied to the average rotation rate of the Sun (the Carrington rotation rate of one rotation every 27.2753 days) we see that features persist for many months but drift in longitude at rates appropriate for the differential rotation at the latitudes they are found (Figure 2). The giant cells are sheared out by the differential rotation itself to form a v-shaped or chevron pattern of cells. Similar patterns are seen at the locations of jet streams in Jupiter’s atmosphere.
Figure 2 | A nine month sequence of longitudinal (east-west) velocity maps showing long-lived giant cells. Each map extends from the south pole at the bottom to the north pole at the top with a full 360 degrees of longitude from left to right. Blue indicates slower longitudinal velocity while red indicates faster longitudinal velocity. Features at high latitudes drift to the left from one month to the next due to the slower than average rotation rate at those latitudes.
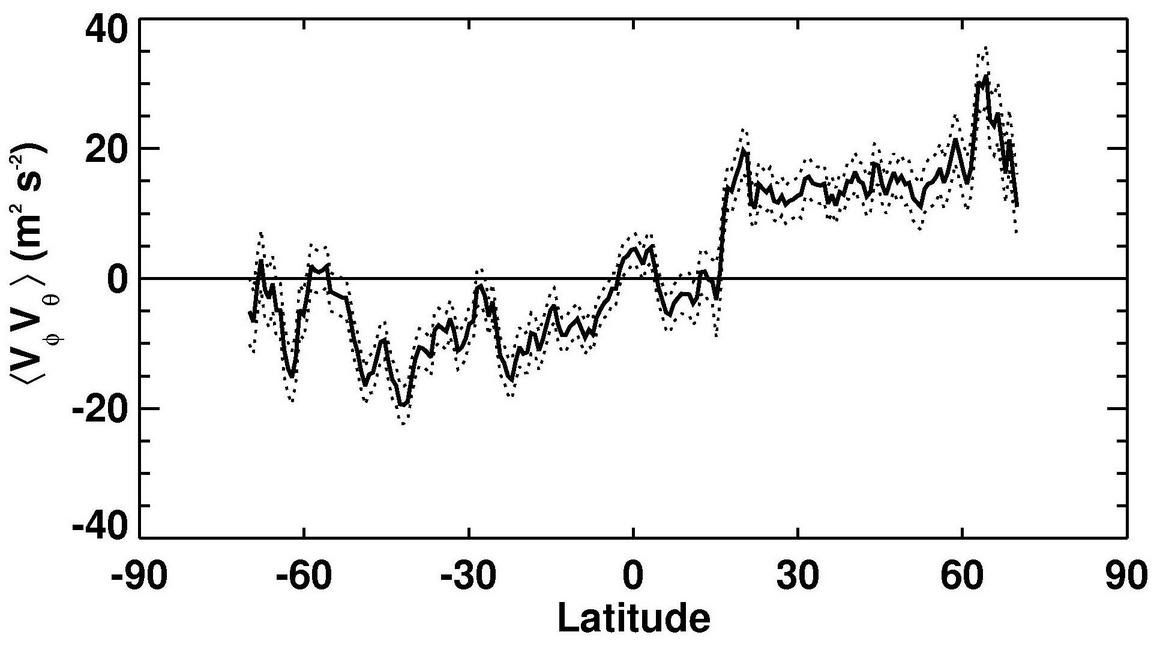
We can calculate the Reynolds stress associated with the flows in these giant cells by taking the product of the longitudinal (east-west) velocity and the latitudinal (north-south) velocity and averaging it over longitude and time at each latitude. The results (Figure 3) show that this product is positive in the north and negative in the south. Thus, longitudinal flows faster than the average rotation speed (red areas in Figure 1B and in the movie) are associated with flows toward the equator (southward in the north and northward in the south). This is exactly what is needed to keep the Sun’s equator rotating more rapidly than its poles.
Figure 3 | The Reynolds stress associated with the giant cell flows. Positive values indicate angular momentum moving southward while negative values indicate angular momentum moving northward. The convergence, at the equator, of the southward transport in the north and the northward transport in the south helps to maintain the Sun’s rapidly rotating equator.
References
[1] Gilman, P. A. 1979, ApJ, 231, 284
[2] Simon, G. W., Weiss, N. O. 1968, Z. Astrophys., 69, 435
[3] Hathaway, D. H., Upton, L., Colegrove, O. 2013, Science, 342, 1217
Thank you for your great work on this subject.
But why was the northern polar region covered with a date area?
What is going on there?
And is there a site that discusses the differences in the Sun’s polar areas vrs its equatorial areas?
We was incredibly prompted to get this web site. I desired to help many thanks just for this specific go through. My spouse and i definitely savored each amount of this and We’ve anyone saved to see brand new things people write-up.
David, would you please comment on the connection between these large-scale flow structures with large-scale structures of magnetic field? Our analysis found that they were often closely related. Particularly, if you look at years of 2011 and 2013 when the Sun was more active than the period you showed here, the correlation between the large-scale flows and magnetic fields is more prominent.