
Sebastián Castellanos Durán1,2
1. Max Planck Institute for Solar System Research, Justus-von-Liebig-Weg 3, 37077 Göttingen, Germany.
2. Observatorio Astronómico Nacional, Universidad Nacional de Colombia, Carrera 45 No. 26 85, 11001 Bogotá, Colombia.
Stepwise changes of the line-of-sight magnetic field (∆BLOS) are seen simultaneously with flares. The vari- ation of the magnetic field is sudden with a duration of few minutes. After the magnetic field has changed, its evolution is seen constant even for hours1. These abrupt and permanent changes of the photospheric magnetic field in flares were discovered more than 25 years ago2, but their origin is still unknown. Currently, ∆BLOS in the photosphere are commonly observed during large flares (>M5)3, and permanent changes in the chromosphere have also been observed4. The diagnostic of ∆BLOS plays an important role in our understanding of the reconfiguration of the magnetic field in solar flares5,4.
We present a statistical analysis of ∆BLOS in 75 flares that occurred during the solar cycle 24. Our study is focused on the excellent capabilities that the Heliospheric and Magnetic Imager (HMI) has to study solar flares: high temporal and spatial resolution with continuous coverage. The flare samples were chosen to cover a wide energy range (from small B-class to extreme X-class flares), and a wide range of heliospheric locations varying from the disk center to the limb. Figure 1 shows a summary of the HMI intensity images of the 47 active regions that host the 75 flares.
Figure 1| HMI continuum images of the 75 flares analyzed. Colored pixels show the locations and sizes of the ∆BLOS, and the black-and-white bars indicate the scale.
We analyze 90-minute time sequences of the HMI magnetograms to study the ∆BLOS, centered around the peak of GOES 1-8 Å light curves. The fields of view (FoVs) range from 80″×80″ to 300″×300″, ensuring that the active regions and the flare processes are fully covered. We fit a stepwise function to the magnetic field evolution of each pixel within the FoV, in order to identify which exhibit a permanent change in their magnetic fields of more than 80 G. 59 out of 75 flares showed permanent changes. In total, we detected 27,153 out of 6×10⁶ such pixels (colored pixels in Figure 1). We find that the magnitude of ∆BLOS range from 80 G (lower threshold) to 750 G. These values are larger compared to the previous studies that reported changes up to 450 G1,3,4.
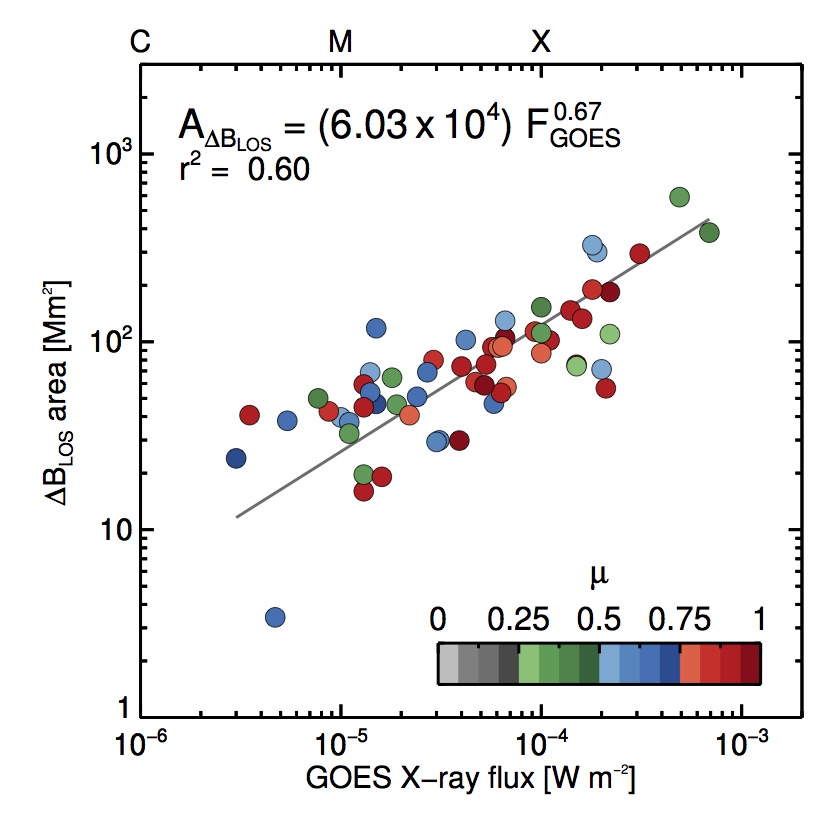
We analyze the location of ∆BLOS and their relation to the energy of the flares. We find pixels with ∆BLOS to be typically located in compact regions (or kernels). 71% of ∆BLOS were located in regions that had magnetic fields larger than |200 G| prior to the flare. The areas of these kernels were correlated with the peak of the GOES flux from the flares (Figure 2). The stronger ∆BLOS tends to be closer to the polarity inversion line (PIL), and the number of these pixels decrease exponentially with distance from the PIL. Additionally, the total signed (and unsigned) magnetic flux density change was larger for larger flares. But in comparison with previous analysis3, we do not find any evidence that the change in the flux depends on the location of the flare. This lack of dependence on the location of the flares may indicate that the magnetic loops do not always increase or decrease after flares5, but also that they may (un-)twist4.
Figure 2| Area of ∆BLOS as a function of soft X-ray flux (proxy to the energy emitted by the flare). Larger flares show larger areas of ∆BLOS.
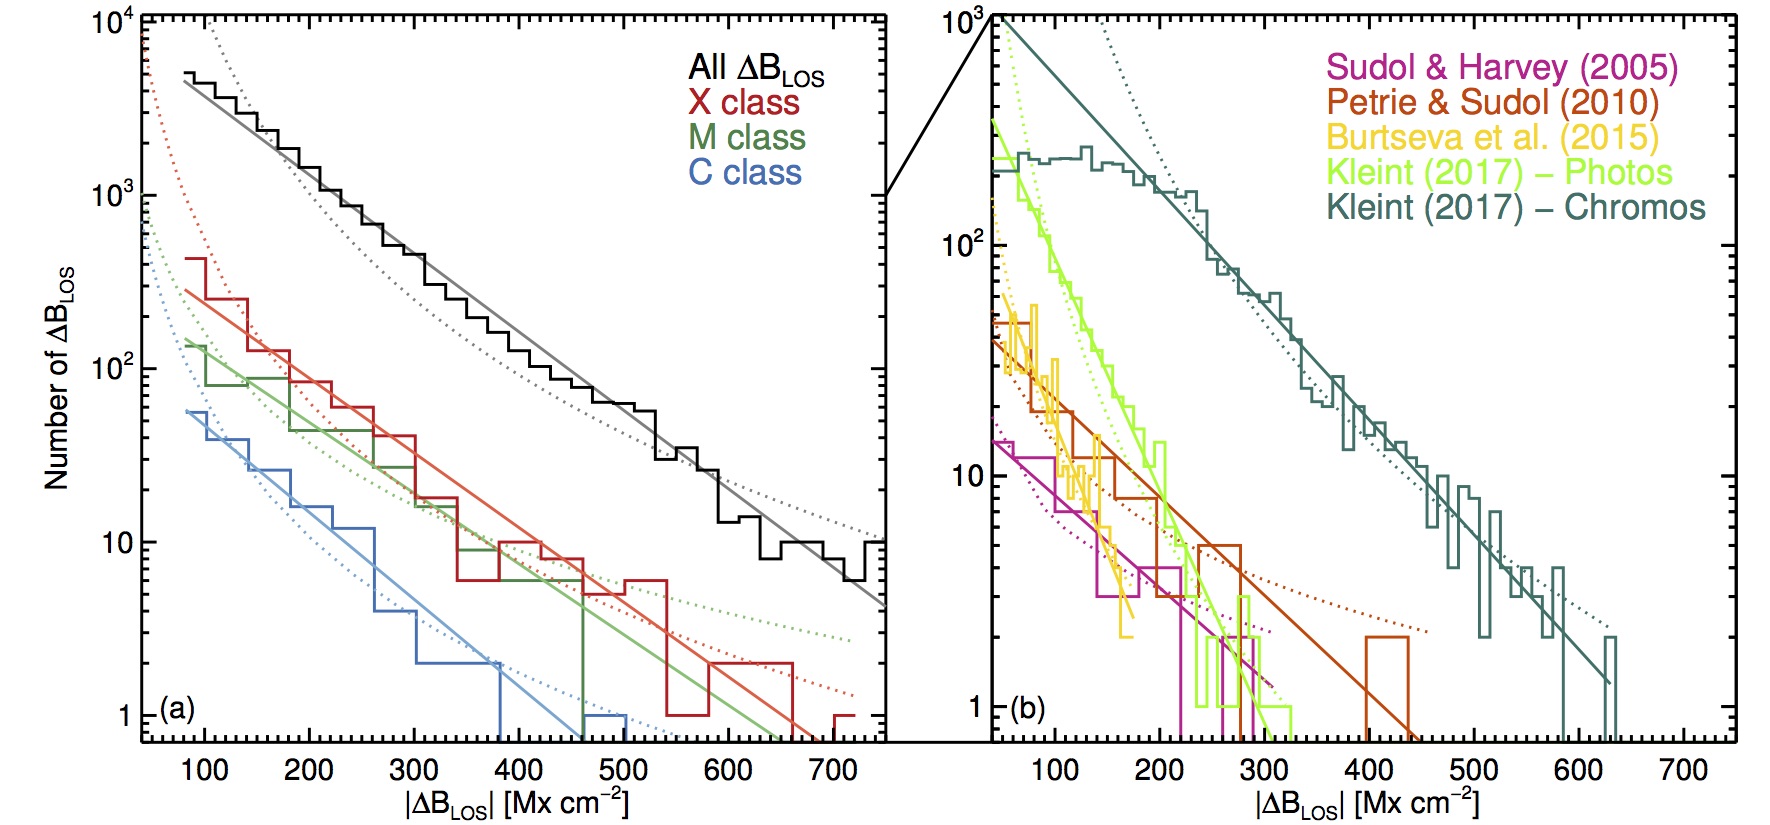
For each flare, we count how many weak and strong ∆BLOS are present. It turns out that there are not only more weak than large ∆BLOS (as one might expect because less input energy is required to change the field), but also the frequency distribution follows an exponential decreasing behavior. This trend was observed in all 59 flares with ∆BLOS separately, and for the whole sample as well (Figure 3, left). We reconstructed the frequency distributions from former publications that used ground-based and satellite data (Figure 3, right). The frequency distributions previously reported were also found to be exponential, demonstrating that the exponential nature of the sizes of ∆BLOS are independent of the spatial resolution of the instrument.
Figure 3| Frequency distribution of sizes of ∆BLOS. Left: three example flares (X4.9, M4.2, and C7.7) and the whole sample of ∆BLOS. Right: Frequency distributions from former publications. Frequency distributions follow decreasing exponential model, which is independent of spatial resolution.
All flares larger than GOES M1.6 class showed ∆BLOS, and in 6 out of 17 C-class flares ∆BLOS are found. It includes a C3.0 flare, which is the smallest flare up to now with ∆BLOS. Based on the observational relations for the area of ∆BLOS, total magnetic flux density change, and the frequency distribution of ∆BLOS, we estimate how many ∆BLOS would be expected to occur during a C1.0 flare located at disk center or μ=0.5. Assuming HMI’s spatial resolution for this example, it turns out that 44 pixels would be expected (or 22 pixels in case of μ=0.5) with a mean ∆BLOS of 133 G. Finding a couple of dozen pixels with ∆BLOS appears to be challenging within the ∼150,000 pixels of an average FoV that contains a regular-size active region. For this reason, we conclude that ∆BLOS are a common phenomenon during flares, probably even for C-class flares. In future analysis, we plan to study the relation of ∆BLOS with the white-light emission, acceleration of particles, and their connection with the production of Sunquakes.
For details of this work, please refer to our recent publication: Castellanos Durán, J. S., Kleint, L., & Calvo-Mozo, B. 2018, ApJ, 852, 25.
References
[1] Sudol, J. J., & Harvey, J. W. 2005, ApJ, 635, 647
[2] Wang, H. 1992, Sol. Phys., 140, 85
[3] Petrie, G. J. D., & Sudol, J. J. 2010, ApJ, 724, 1218
[4] Kleint, L. 2017, ApJ, 834, 26
[5] Hudson, H. S. 2000, ApJL, 531, L75