
A.A. Norton, A. Mendez, R. Chen, M. Dikpati, S. Aswin Amirtha Raj
Solar Cycle 24 data are used to determine how often the Sun emerges sunspots in activity nests, i.e., regions where sunspots and active regions (ARs) repeatedly emerge. We use the Solar Photospheric Ephemeral Active Region (SPEAR) catalog created from Helioseismic and Magnetic Imager (HMI) data as well as the HMI Carrington Rotation maps of radial magnetic field, Br. The tendency of ARs to cluster in longitude and persist in preferred regions of the Sun for extended periods was noted as early as 1863 by Carrington who suspected that active regions were not uniformly and randomly distributed in longitude[1]. Later, Bumba (1969)[2] reported on regions that emerged repeatedly with rotation rates of ~27 days and Gaizauskas (1983)[3] found that these complexes of activity were maintained for 3-6 solar rotations.
We find that the Sun shows moderate nesting behavior with 41% (48%) of AR magnetic flux found in northern (southern) hemispheric located in nests that are short-lived (average lifetimes 3.3 – 4.0 months) with the definition of nesting being that three or more active regions must emerge within +/- 5◦ latitude and +/- 7.5◦ longitude within four Carrington rotations [4,5]. Different rotation rates are used to search for nests that may not be evident by eye. The maximum number of nests are found with slightly prograde rotational velocities, with significant nest flux also found at synodic 451–452 nHz prograde and 409–411 nHz retrograde frequencies.
Figure 1| The North hemispheric magnetic activity is shown for Cycle 24, May 2010 Dec 2020, using HMI Carrington Rotation maps of Br data (top panel). The color scale is such that ARs are shown in light blue (weakest), yellow, green, and red (strongest) on a dark blue background that indicates quiet-Sun. Activity nests are identified in the SPEAR catalog data using the criteria of three ARs found within 4 CRs with ±7.5◦ longitude and ±5◦ latitude of each other with rotational frequency at the b) Carrington rate, and c) slightly prograde with respect to the Carrington rate. Different nests are shown using different colors while the symbol size is proportional to the amount of flux of the region. See [5] for South hemispheric nest distribution.
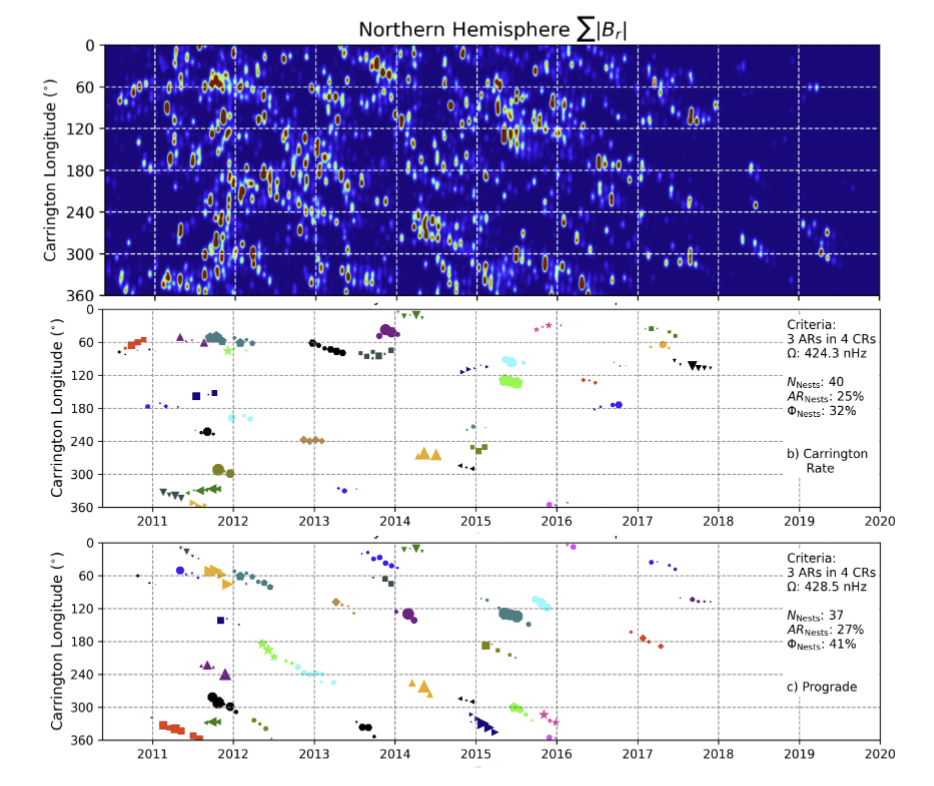
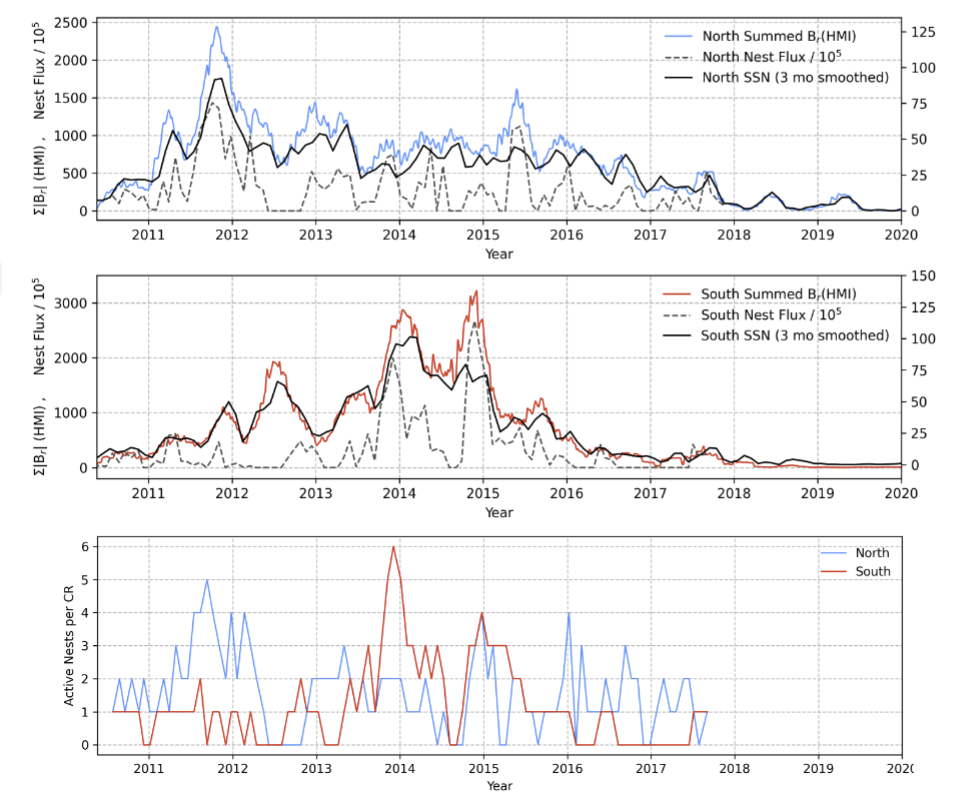
Figure 2| The amount of magnetic flux in activity nests (gray dashed line, Castenmiller criteria and Carrington rotation rate) is shown in context with the monthly hemispheric sunspot number (black line) as a function of time for the North (top panel) and South hemisphere (middle panel). The plotted sunspot number has a boxcar smoothing of 3 months. Overplotted is a time series of HMI Br values summed over the North (blue line) and South (red line) latitudes of 0-30◦ in a width of 1◦ longitude increments in the Carrington rotation data, which allows for a time series to be created from the synoptic data. The plotted Br data has a boxcar smoothing of 3 months. The number of activity nests in the North (blue) and South hemispheres (red line) as a function of time are shown in the bottom panel.
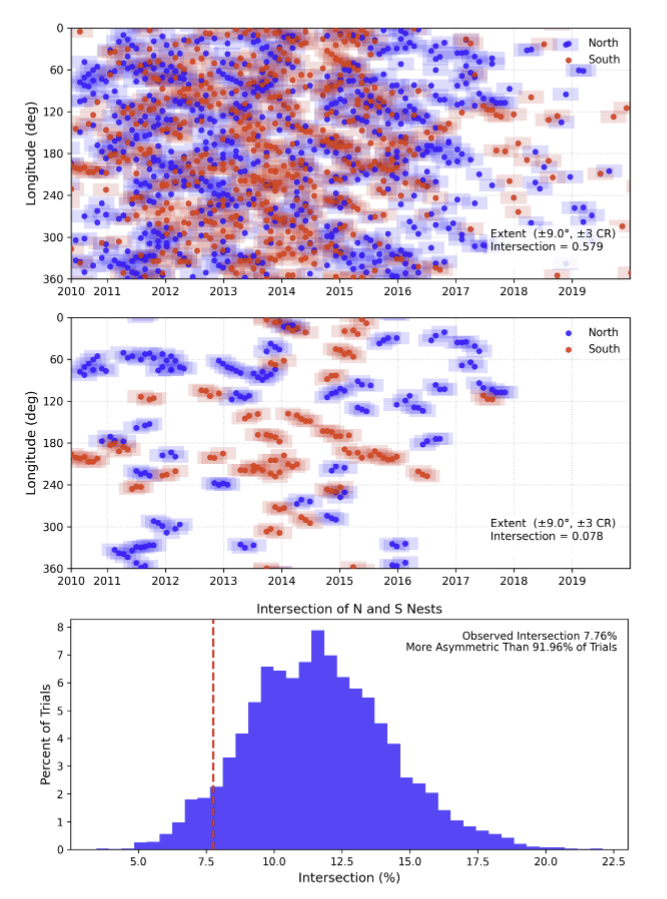
One of the most striking results is that activity nests are strongly asymmetric between the northern and southern hemispheres when examined in time and longitude. While individual active regions show substantial overlap between hemispheres, meaning that about 58% of all active regions have a counterpart at similar longitude and time, this symmetry breaks down dramatically for nests. Only about 8% of nests are symmetric across the equator, meaning that when a nest forms in one hemisphere, it is usually absent in the other at the same time and longitude. Much of this asymmetry is due to the northern and southern hemispheres having bursty magnetic behavior that is out of phase in time. Monte Carlo tests confirm that this asymmetry is unlikely to arise by chance. The observed distribution of nests is more asymmetric than ~92% of cases that are randomized longitude indicating that the effect reflects an underlying physical process rather than random statistical differences.
Figure 3| The distribution of individual ARs from the North and South hemispheres is shown (top panel) in blue and red symbols with some dilation of ±9◦ longitude and ±3 Carrington rotations. The number of intersections of individual ARs in the North and South is noted as 0.579 (∼58%). Nests identified using the Castenmiller criteria of 3 ARs in 4 CRs are shown (middle panel) with only 7.8% of the ARs in nests intersecting. Randomization trials show that this hemispheric asymmetry in the nest locations is more asymmetric than ∼92% of trials.
This hemispheric asymmetry provides an important clue about the origin of activity nests. If nests were driven by large-scale convective structures that span both hemispheres, we might expect more symmetry across the equator. Instead, the observed asymmetry suggests that nests are linked to non-axisymmetric or decoupled processes in the solar dynamo acting separately in the hemispheres. Possible explanations include hemispheric, asymmetric flows that amplify and cycle the axial quadrupole on a timescale on the order of months to a few years, inertial or magneto-Rossby waves, or instabilities acting on toroidal magnetic fields independently in the hemispheres. See Norton et al. (2026)[5] for more details.
References:
[1] Carrington, R. C. 1863, Observations of the Spots on the Sun from November 9, 1853, to March 24, 1861, Made at Redhill (London: Williams and Norgate)
[2] Bumba, V., & Howard, R. 1969, Sol. Phys., 7, 28
[3] Gaizauskas, V., Harvey, K. L., Harvey, J. W., & Zwaan,C. 1983, ApJ, 265, 1056
[4] Castenmiller, M. J. M., Zwaan, C., & van der Zalm, E. B. J. 1986, Sol. Phys., 105, 237
[5] Norton, A., Mendez, A., Chen, R., Dikpati, M., Amirtha Raj, S. Aswin, 2026, JAA, accepted. https://arxiv.org/abs/2511.03646
That’s a really interesting look at how sunspots form. It’s fascinating to see the differences in nesting behavior between the northern and southern hemispheres.