
Fraser Watson
National Solar Observatory, Tucson, AZ, 85719, USA
The nature of the solar magnetic field within sunspots has always been of great interest in solar physics as it is these strong fields that lead to other events we know as solar activity. This topic was once again brought to the forefront in an article by Penn and Livingston1 which indicated a possible long term decrease in umbral magnetic field strengths from 1998-2006. This result was made stronger by the (so far) weak nature of solar cycle 24 compared to cycle 23.
To provide a comparative check for this result, as well as more recent results such as those published in Livingston, Penn and Svalgaard2, intensity and magnetogram data from the HMI and MDI instruments have been used to study the magnetic properties of sunspot umbrae from the launch of MDI in 1996 through the beginning of 2014. Automated sunspot detection algorithms (STARA, see Watson et al.3) were applied to the space-based data and were used in conjunction with Livingston’s manual sunspot detections (which we will refer to by the instrument name, BABO) to allow a comparative analysis between the two catalogs containing 26921 and 2700 sunspot umbra detections respectively.
Previous studies have presented the long-term magnetic field data as an annually binned average and so the MDI and HMI data is presented in the same manner for consistency. The trend in umbral magnetic fields over time is shown in Figure 1.
Figure 1| Annual average magnetic field in the darkest part of sunspot umbrae for the MDI, HMI and BABO data sets. Error bars indicate the standard deviation of all measurements for that year.
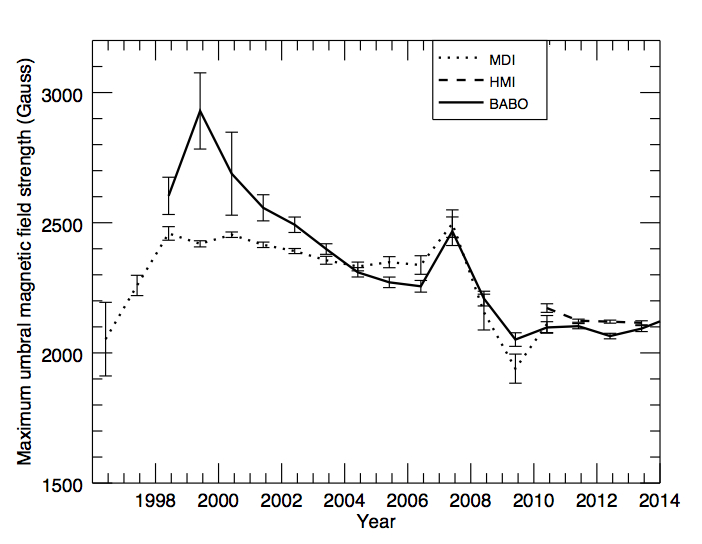
If we split this data into two time periods we can see that from 1998-2003 there is poor agreement between the BABO and MDI data. However, from 2004-2014 there is a far better agreement during the rest of the MDI observations and the subsequent HMI measurements. This led us to believe there may be a change in either BABO or MDI data over time as it is strange that the results from the two sources did not agree at first, but did later. The first step was to investigate how often measurements were taken. For MDI and HMI, this is relatively simple as these measurements are part of a synoptic campaign with excellent temporal coverage. However, BABO measurements are taken, at most, a few days per month. This means that the total number of umbrae measured is not a meaningful quantity due to the different observing cadences. To counteract this, we calculated the mean number of umbrae observed per observing day, a number which should correlate well with the sunspot number. A plot of this quantity for HMI, MDI and BABO is presented in Figure 2.
Figure 2| Average number of umbrae observed per observing day. Only days where at least one umbra was observed are included.
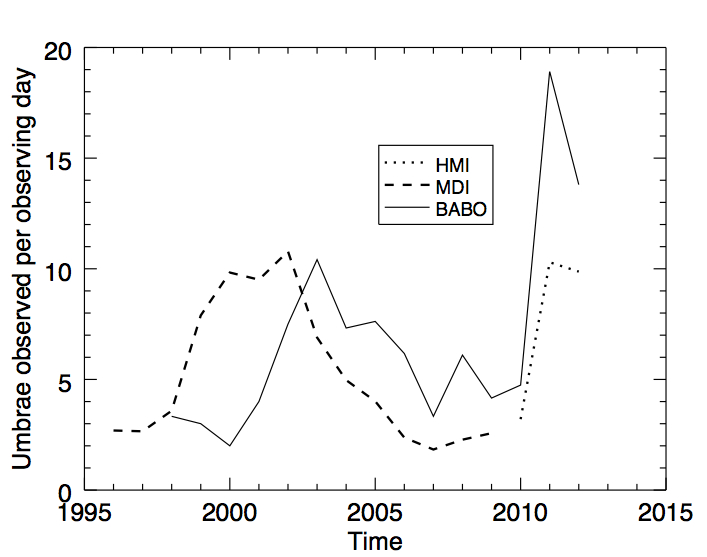
This plot introduces some interesting questions. First of all, the MDI data produces a nice smooth curve that follows the sunspot number over solar cycle 23 and the double peak of that cycle is also visible in the data. However, the BABO data does not exhibit the same trend. In fact, this data would indicate that the sunspot number was rising from 1998-2003 at which point it hit a maximum and then declined afterwards. We know that this is not the case and so this provides evidence that the BABO data from 1998-2003 may not be a representative sample of the whole sunspot population. We also see that there are many more sunspots observed per day in the BABO data after 2010, which must also be a result of more detailed sampling. Comparing individual sunspots has also been completed for small numbers of sunspots and BABO magnetic fields agree well with those from HMI and MDI in all years.
As such, we conclude from this analysis that the BABO data set was not truly representative of the sunspot population in the early years of the study. This changed around 2003 as the observations became more rigorous. This also means that the long term trends reported previously should be revised. Whereas a decrease of 800 Gauss in umbral magnetic fields has been reported between 1998 and 2012, the HMI and MDI data indicate a decrease of only around 300 Gauss. The continuing availability of the excellent HMI data set will allow us to continue to refine this study as solar cycle 24 evolves.
References
[1] Livingston, W.C., Penn, M.J., Svalgaard, L. 2012, ApJL 757, L8.
[2] Penn, M.J., Livingston, W.C. 2006, ApJL 649, L45.
[3] Watson, F.T., Fletcher, L., Dalla, S., Marshall, S, 2009, Solar Phys. 260, 5.
Pingback: Sunspots 2014: April Record Exonerates Scientists | The Global Warming Policy Foundation (GWPF)
It is interesting to see the magnetic field strength inside sunspot umbrae continues to drop, although with a rate smaller than previously reported. It is puzzling to see there is an abrupt strength change between cycle 23 and cycle 24, any insight why that is the case? Moreover, if the sunspot population explains the difference between BABO and MDI in earlier years, it is still puzzling why the BABO data were quite smooth and consistent in years of 1998-2003. One would expect it a bit more random or noisier, isn’t it?