
A.A. Norton1
1. Department of Physics, Stanford University
The Sun’s northern and southern hemispheres exhibit different behaviors during the evolution of the solar cycle. For example, in Solar Cycle 24, the northern hemisphere peaked around 2011 to 2012, while the southern hemisphere peaked in 2014 to 2015. Where does this north-south asymmetry come from? A new study using HMI magnetograms and sunspot records points to a small subset of active regions (ARs) as the culprit[1].
Active regions do not emerge at random locations. Many appear in “activity nests,” clusters of ARs that emerge repeatedly near the same latitude and longitude over several solar rotations. Following Castenmiller[2], a nest is defined as at least three ARs appearing within four solar rotations and within ±7.5 degrees of longitude and ±5 degrees of latitude of one another. A companion study[3] found that roughly 40 to 50 percent of AR magnetic flux in Cycle 24 emerges in nests.
We examined active regions from Solar Cycles 22 to 24 and asked: does an AR in one hemisphere have a “partner” at a similar longitude and time in the other hemisphere? ARs with a partner (within +/-10 degrees of longitude and +/-one solar rotation) were counted as symmetric; those without, as asymmetric. We compared the results with thousands of Monte Carlo simulations in which AR longitudes were randomized.
The answer is clear (Figure 1). ARs that belong to nests are strongly asymmetric: in Cycle 24, 63 percent of nest-member ARs had no counterpart in the opposite hemisphere, compared with 44 percent expected by chance, a 3.5 sigma result. Cycles 22 and 23 show the same behavior. When nest-member ARs are removed, the remaining population looks entirely random, with an observed asymmetry of 30 percent that exactly matches the simulations. In other words, the background process of AR emergence is essentially symmetric between the northern and southern hemispheres. The asymmetry lives in the nests.
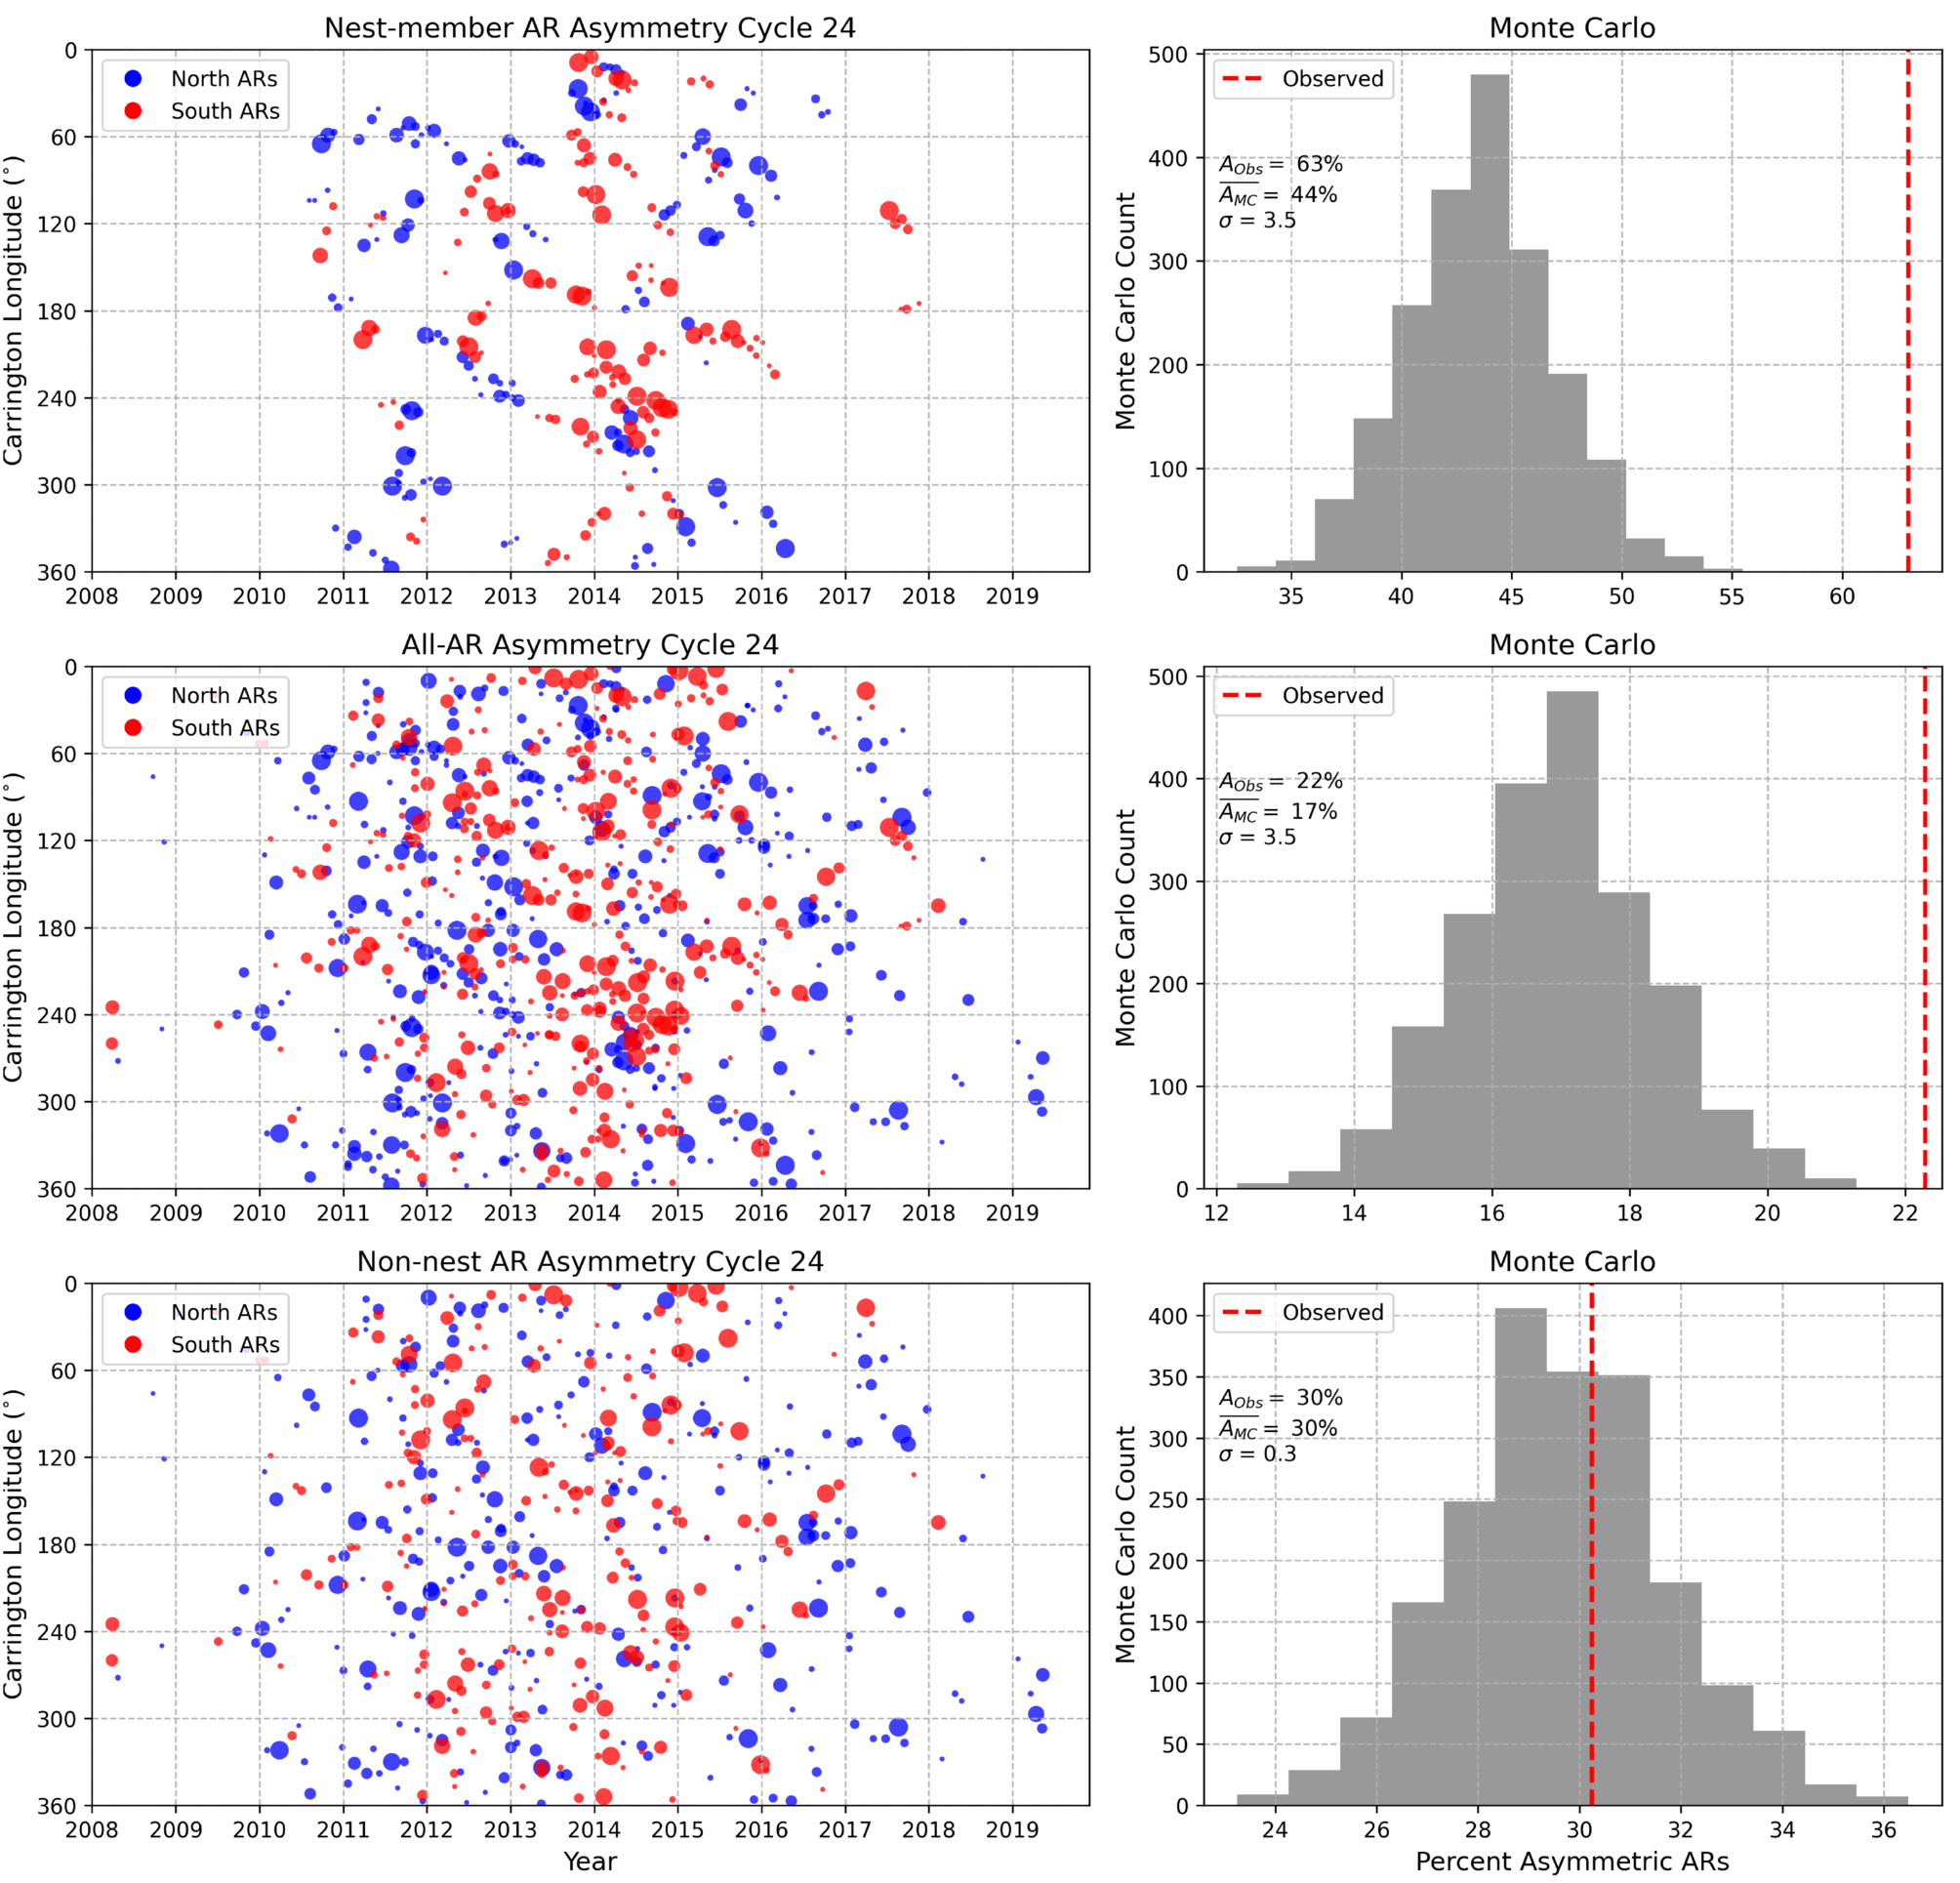
Figure 1. Left: Longitude and time of Cycle 24 active regions in the north (blue) and south (red) for nest members (top), all ARs (middle), and non-nest ARs (bottom). An AR with no counterpart in the opposite hemisphere (within ±10° longitude and ±one solar rotation) is counted as asymmetric. Right: The observed asymmetry (dashed red line) compared with random Monte Carlo realizations (gray). Nest members and all ARs are significantly asymmetric (3.5σ); non-nest ARs are consistent with random (0.3σ).
How much of solar activity is involved? A conservative metric involving nesting and asymmetry together imply that roughly 6 to 18 percent of all ARs belong to a nonrandom, hemispherically asymmetric nesting component. A small fraction of ARs is enough to give each hemisphere its own personality.
HMI data also reveal when this happens. Wavelet analysis of the hemispheric magnetic flux measured by HMI shows that each hemisphere produces bursts of activity at different times, both on roughly monthly timescales and on the quasi-biennial timescale of about 150 to 300 days (one of the solar “QBO” periodicities). The northern hemisphere had its strongest quasi-biennial burst in 2011, while the southern hemisphere had several peaks from late 2013 through early 2015. The number of nests in each hemisphere rises and falls with that hemisphere’s QBO signal, with correlation coefficients of 0.54 in the north and 0.46 in the south (Figure 2).
Finally, we decomposed HMI synoptic maps into the Sun’s large-scale magnetic components: the axial dipole, quadrupole, and octupole (following DeRosa[4]). During Cycle 24, there were extended intervals when the quadrupole, a field pattern that is symmetric across the equator rather than antisymmetric like the dipole, was as strong as or stronger than the dipole. These intervals overlap the periods of enhanced nesting, strong hemispheric QBO activity, and the polar field reversals. Dynamo theory predicts that when dipole-like and quadrupole-like field families become comparable in strength, their interaction can boost activity in one hemisphere while suppressing it in the other5. The observations are consistent with this “mixed-parity” picture, although surface measurements alone cannot prove what is happening in the interior.
Together, these results suggest that activity nests are an observational fingerprint of how the solar dynamo couples the two hemispheres, linking the quasi-biennial oscillation, the large-scale magnetic field, and the uneven way the Sun distributes its activity.
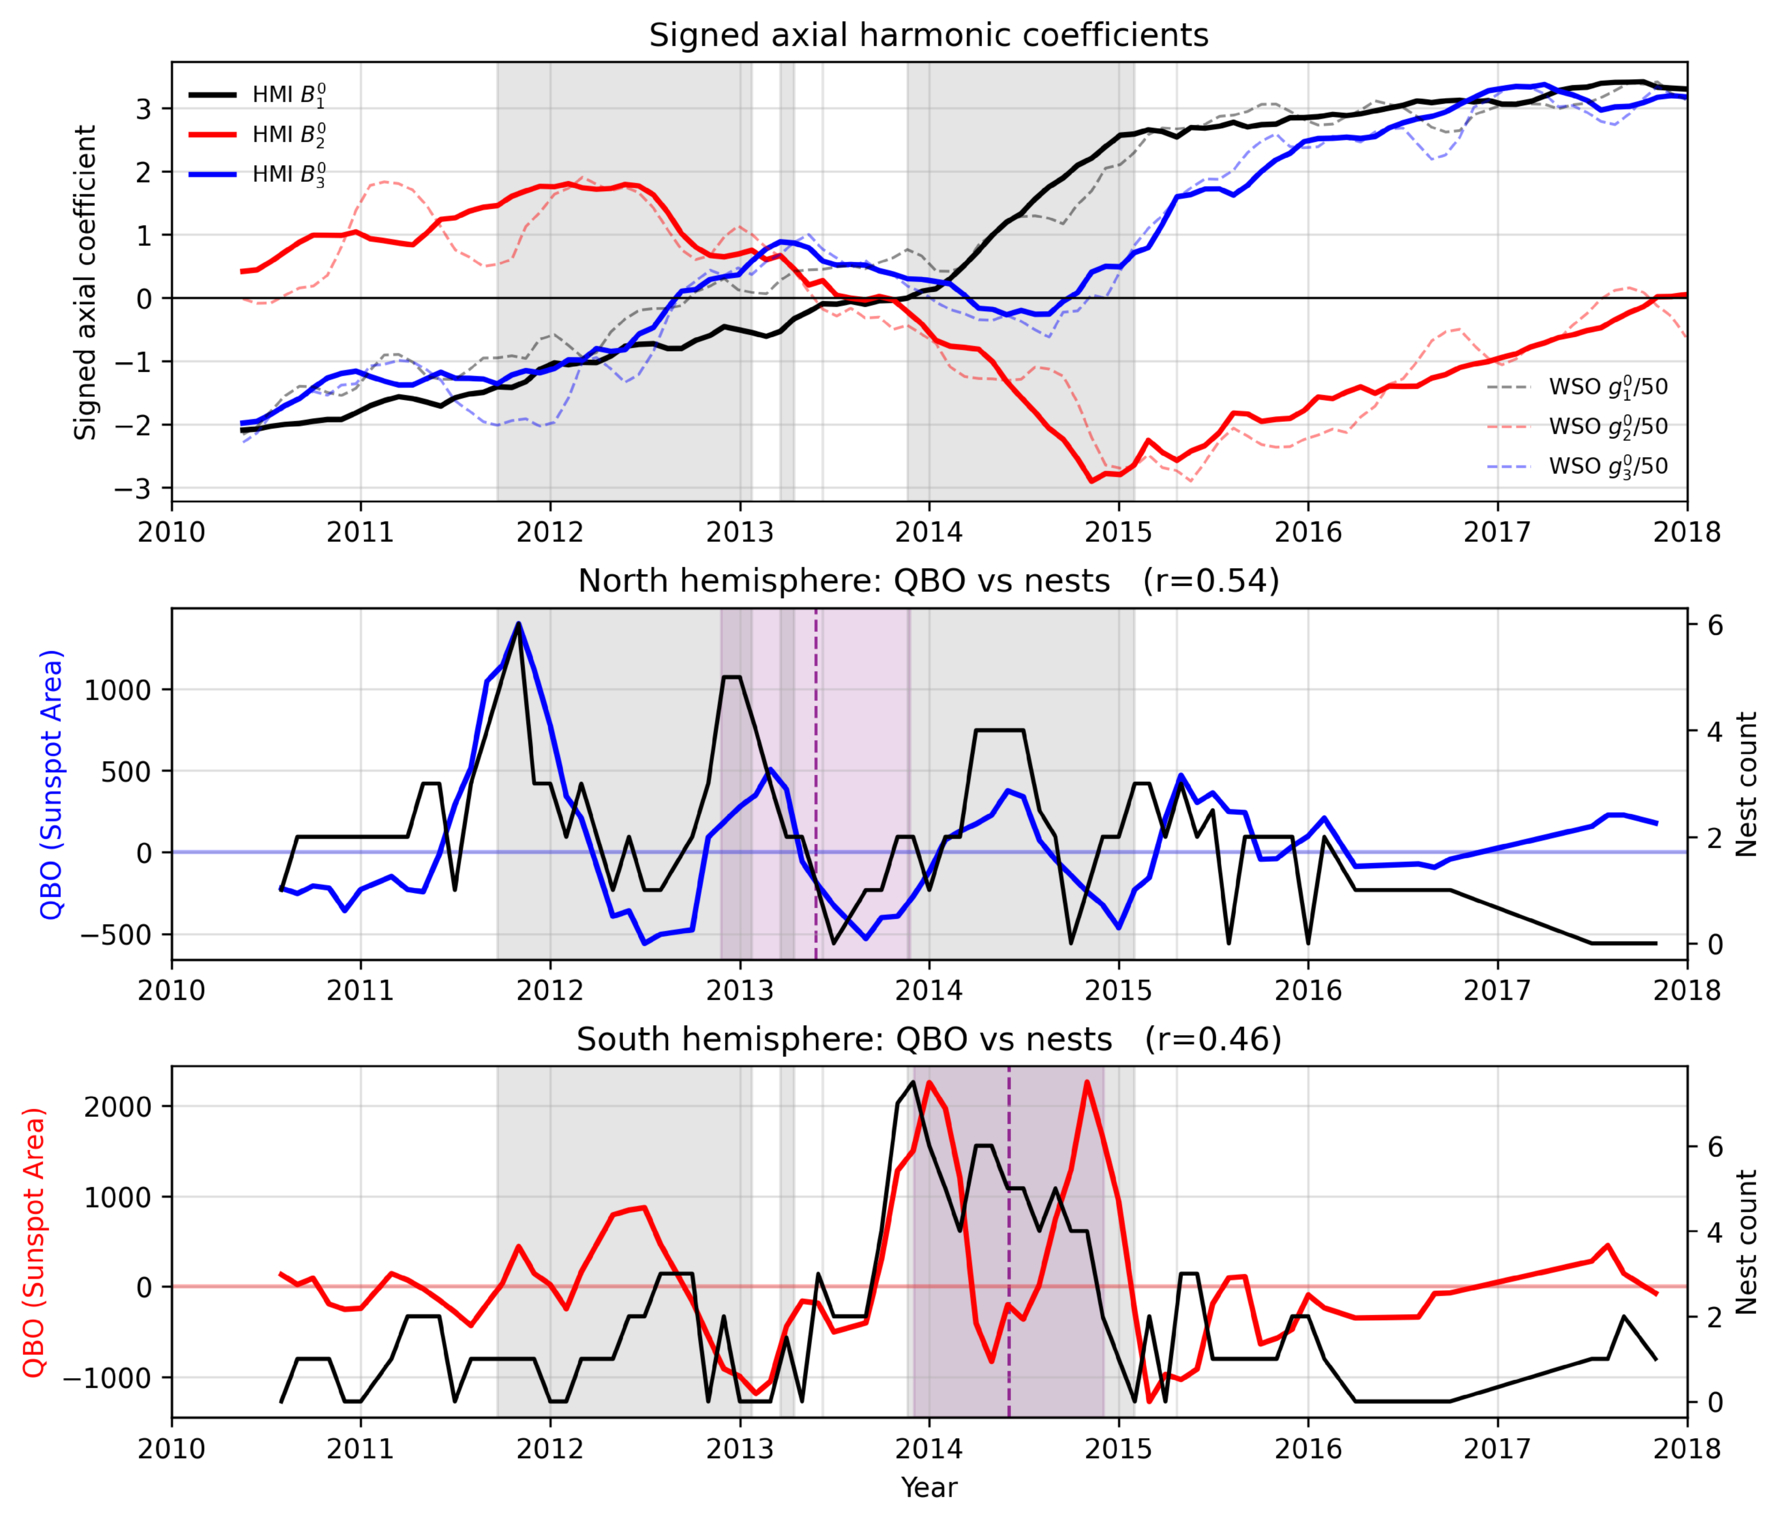
Top: Evolution of the Sun’s axial dipole (black), quadrupole (red), and octupole (blue) magnetic components during Cycle 24, from HMI (solid) and WSO (dashed, rescaled for comparison). Gray shading marks times when the quadrupole is as strong as or stronger than the dipole; purple shading marks the polar field reversals. Middle and bottom: Quasi-biennial (QBO) variations in sunspot area (blue, north; red, south) and the number of activity nests (black). Enhanced nesting coincides with strong QBO activity and with intervals when the quadrupole rivals the dipole.
References
[1] Norton, A.A., 2026 ApJL, 1009, L31
[2] Castenmiller, M. J. M., Zwaan, C., & van der Zalm, E. B. J., 1986, SoPh, 105, 237
[3] Norton, A., Mendez, A., Chen, R., Dikpati, M., & Aswin Amirtha Raj, S., 2026, JApA, 47, 48
[4] DeRosa, M. L., Brun, A. S., & Hoeksema, J. T. 2012, <i<ApJ, 757, 96
[5] Gallet, B., & Pétrélis, F. 2009, PhRvE, 80, 035302